Fig. 3
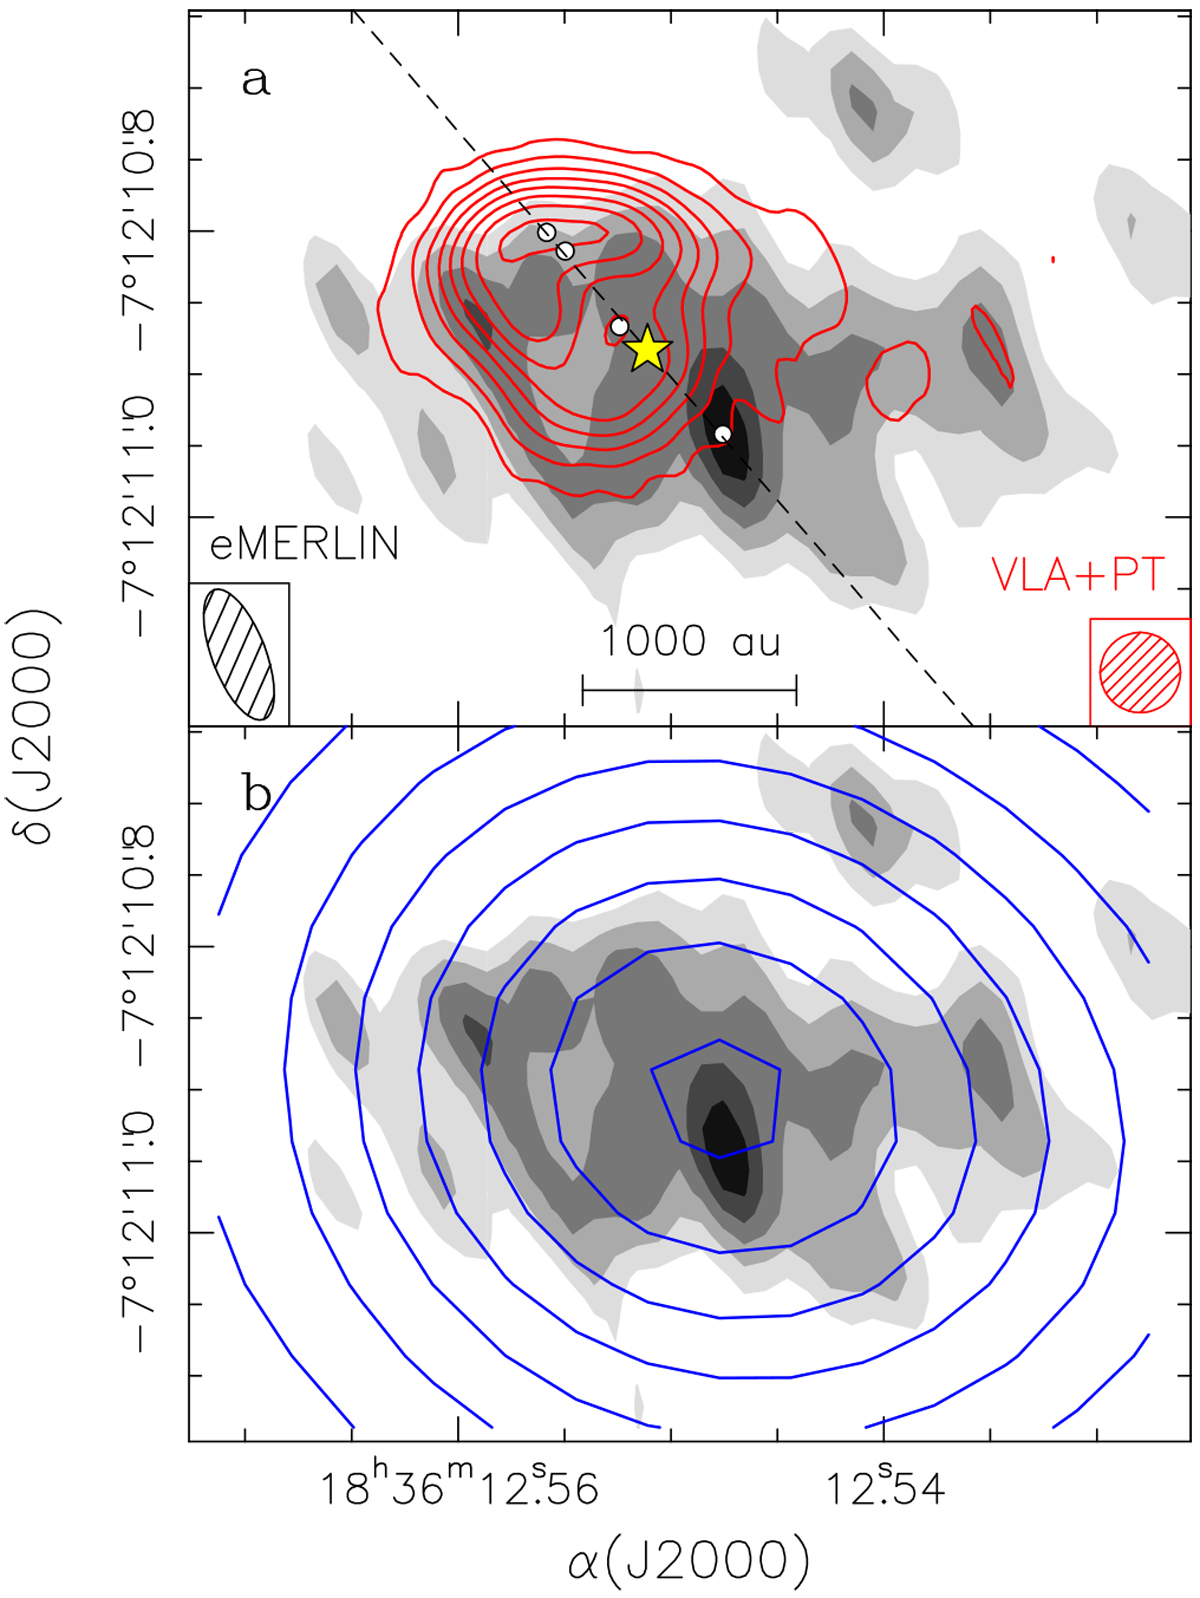
Panel a: contour map of the 7 mm continuum emission from Beltrán et al. (2007) overlaid on our grey-scale image of the e-MERLIN map obtained at 5 cm. Contour levels range from 0.93 (=3σ) to 10.23 in steps of 1.55 mJy beam−1, while grey-scale levels range from 156 (=2σ) to 468 in steps of 78 μJy beam−1. The synthesised beams of the two maps (0.′′56 × 0.′′56 for the VLA and 0.′′097 × 0.′′038 with PA = 21° for the e-MERLIN image) are shown in the bottom left and right corners. The white dots denote the positions of the emission peaks at (from NE to SW) 7 mm, 1.3 cm, 3.6 cm, and 5 cm, while the dashed line is the best fit to these peaks. The star symbol indicates the estimated position of the star ionising the H II region (see Sect. 4.3). Panel b: same as upper panel, with a contour map of the 6 cm continuum emission imaged with the VLA. Contour levels range from 0.51 (=3σ) to 10.03 in steps of 1.3 mJy beam−1. The synthesised beam of the VLA image is 0.′′415 × 0.′′38 with PA = –16°.
Current usage metrics show cumulative count of Article Views (full-text article views including HTML views, PDF and ePub downloads, according to the available data) and Abstracts Views on Vision4Press platform.
Data correspond to usage on the plateform after 2015. The current usage metrics is available 48-96 hours after online publication and is updated daily on week days.
Initial download of the metrics may take a while.