Fig. 2
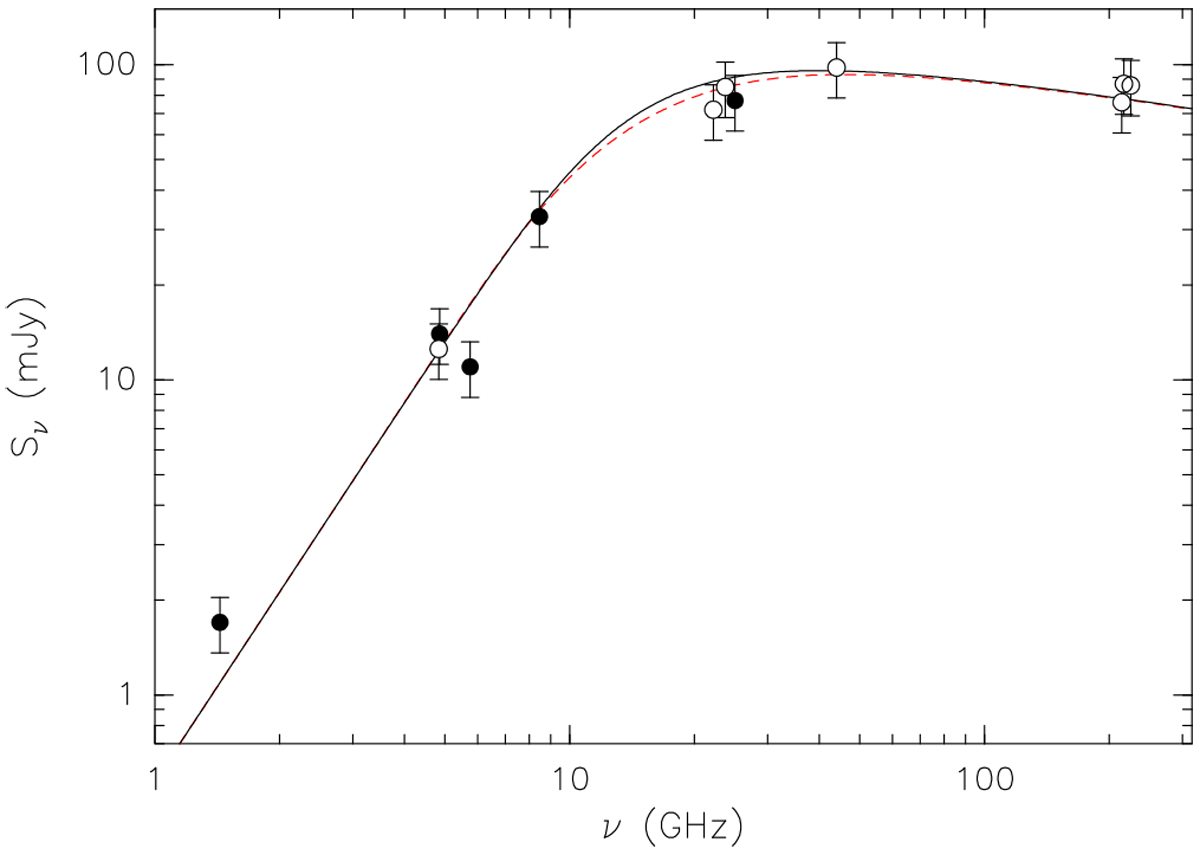
Spectrum of the continuum emission from the HC H II region G24 A1. The points represent the measurements from our data (solid circles) and previously published data (empty circles), listed in Table 2. The error bars take into account both the errors given in the table and a conservative calibration uncertainty of 20%. The solid curve is the best fit to the data obtained for a spherical H II region, while the dashed curve is the best fit for a shell H II region with an inner radius 99% of the outer radius (see Sect. 4.1 for details on the model fit).
Current usage metrics show cumulative count of Article Views (full-text article views including HTML views, PDF and ePub downloads, according to the available data) and Abstracts Views on Vision4Press platform.
Data correspond to usage on the plateform after 2015. The current usage metrics is available 48-96 hours after online publication and is updated daily on week days.
Initial download of the metrics may take a while.