Fig. 1
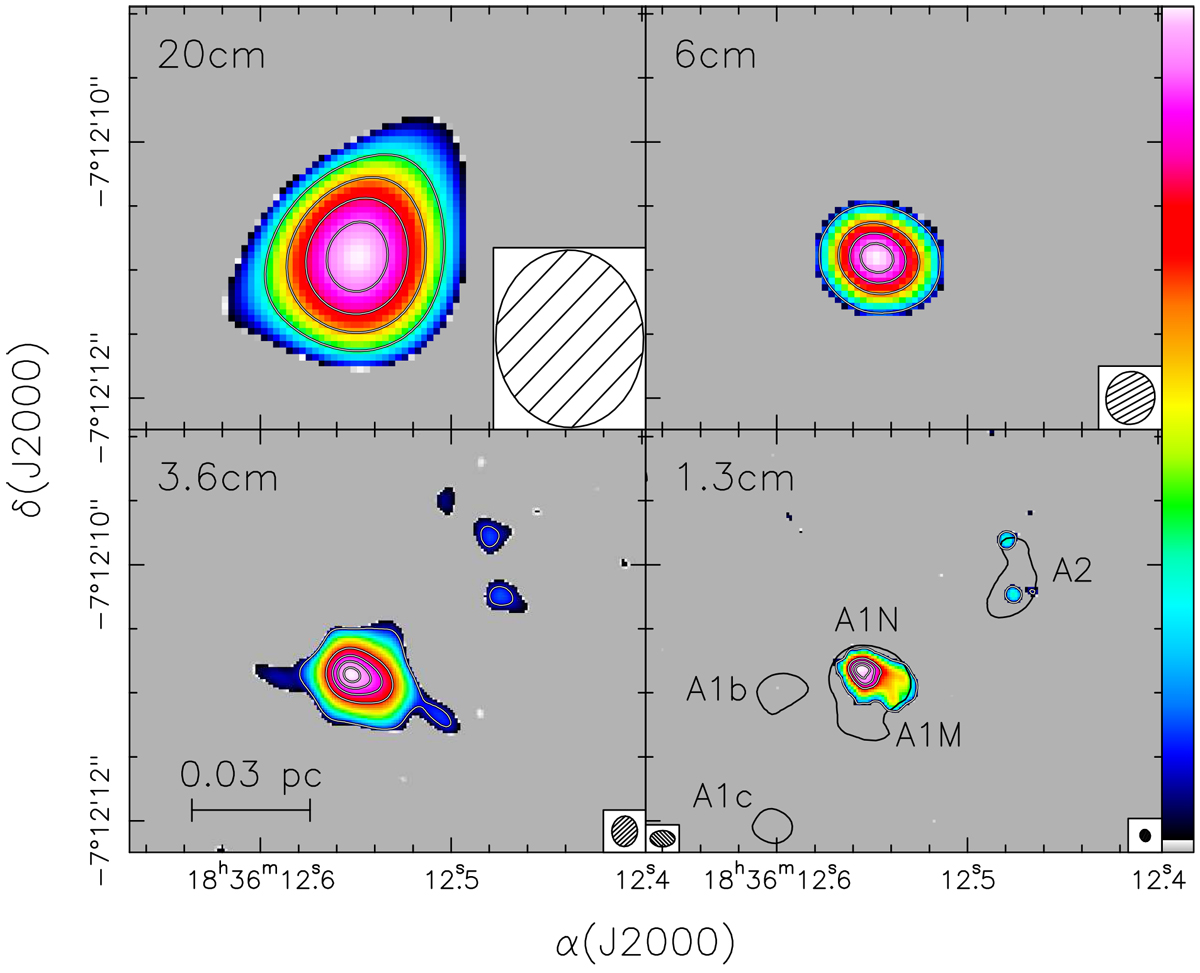
Maps of the continuum emission from the HC H II region G24 A1 observed with the VLA at four wavelengths as indicated in each box. A logarithmic scale has been used to enhance the weakest features. The ellipse in the bottom right corner indicates the full width at half power of the synthesised beam of each map (see also Table 1). The black contours in the bottom right panel correspond to the 4σ level of the ALMA 1.4 mm map of Cesaroni et al. (2017) and M2018. The corresponding beam is shown in the bottom left of the panel. White contour levels range from 0.9 to 1.98 in steps of 0.36 mJy beam−1 at 20 cm, from 0.85 to 8.5 in steps of 2.55 mJy beam−1 at 6 cm, from 0.17 to 13.77 in steps of 3.4 mJy beam−1 at 3.6 cm, and from 0.115 to 13.915 in steps of 4.6 mJy beam−1 at 1.3 cm. In all cases, the minimum contour level corresponds to 5σ.
Current usage metrics show cumulative count of Article Views (full-text article views including HTML views, PDF and ePub downloads, according to the available data) and Abstracts Views on Vision4Press platform.
Data correspond to usage on the plateform after 2015. The current usage metrics is available 48-96 hours after online publication and is updated daily on week days.
Initial download of the metrics may take a while.