Fig. 9.
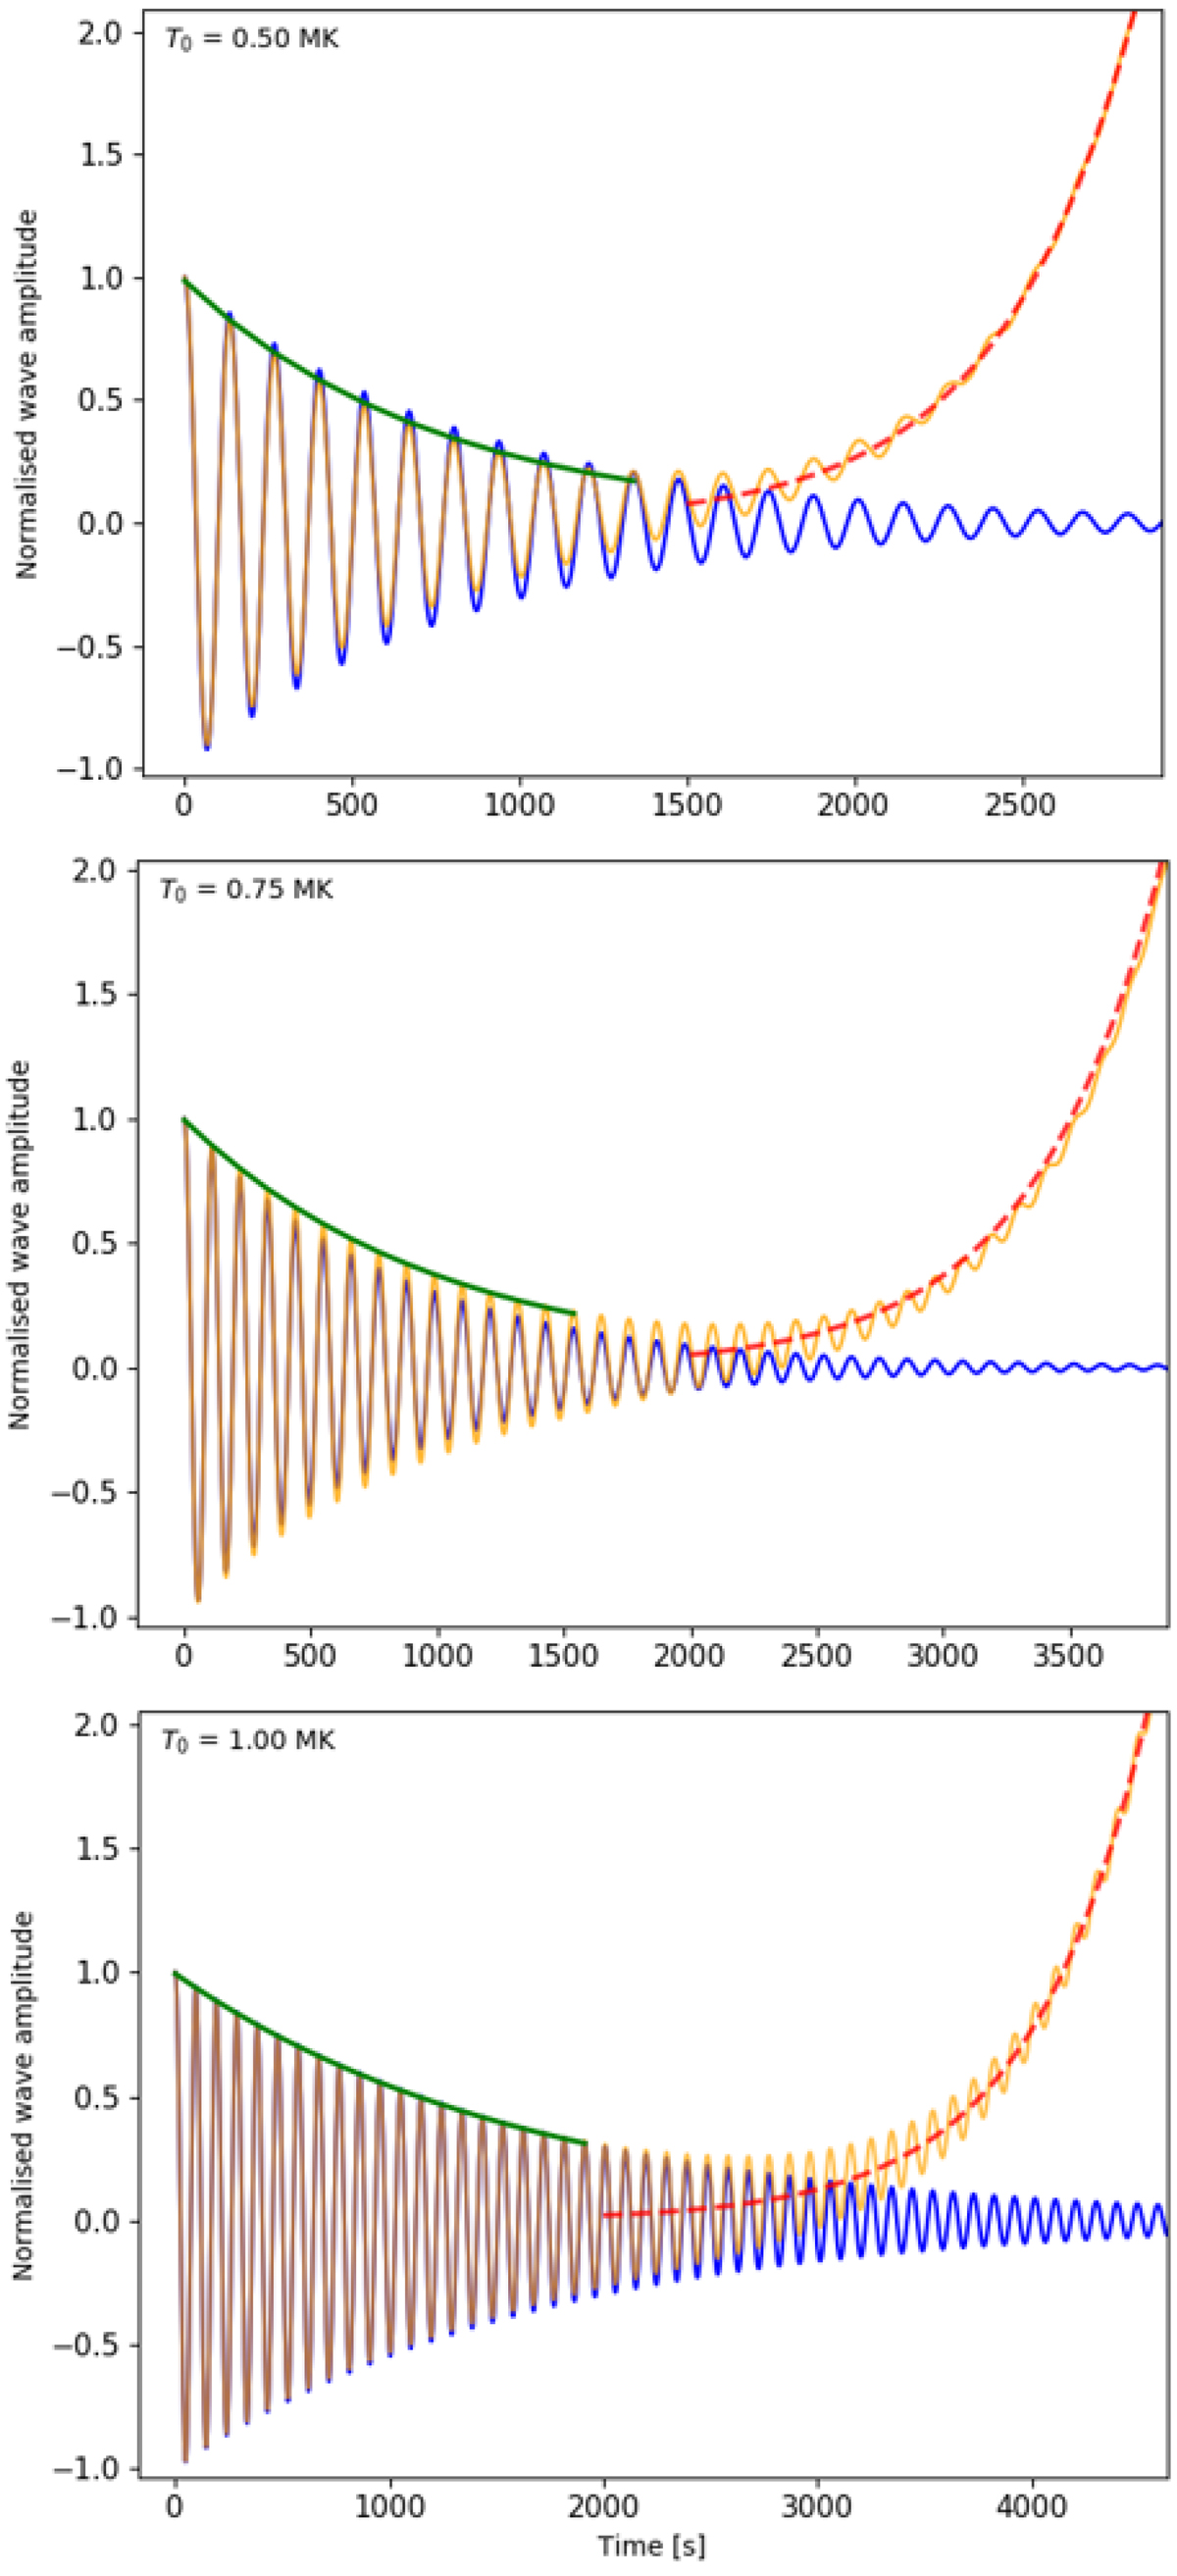
Normalized slow wave amplitude as a function of time for T0 equal to 0.50 MK (top panel), 0.75 MK (middle panel) and 1.00 MK (bottom panel). Blue is the theoretical profile, obtained by solving the dispersion relation. Yellow is the wave amplitude from the simulation, green denotes an exponential fit of the wave maxima. The red dotted line is an exponential fit of the steeply increasing amplitude, due to the runaway effect of the thermal instability. The top figure uses the isobaric growth rate to draw the theoretical wave amplitude, while the bottom two figures use the isochoric one.
Current usage metrics show cumulative count of Article Views (full-text article views including HTML views, PDF and ePub downloads, according to the available data) and Abstracts Views on Vision4Press platform.
Data correspond to usage on the plateform after 2015. The current usage metrics is available 48-96 hours after online publication and is updated daily on week days.
Initial download of the metrics may take a while.