Free Access
Fig. 10.
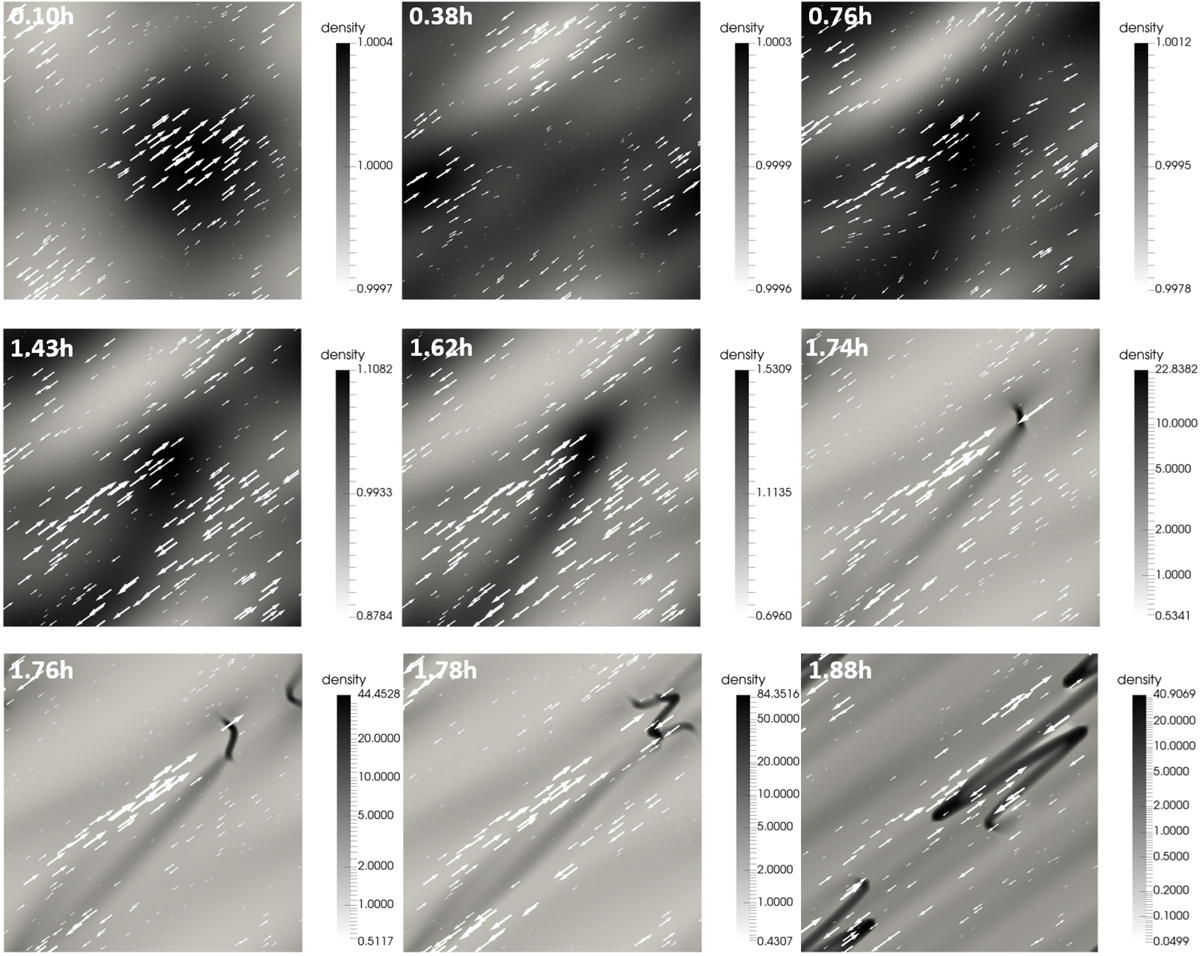
Temporal evolution of the density distribution for a superposition of two slow waves. The time at each panel is given in hours in the top-left corner of each figure. The velocity vector field is denoted by white arrows. Density is normalized to 2.34 × 10⁻¹⁵ g cm−3.
Current usage metrics show cumulative count of Article Views (full-text article views including HTML views, PDF and ePub downloads, according to the available data) and Abstracts Views on Vision4Press platform.
Data correspond to usage on the plateform after 2015. The current usage metrics is available 48-96 hours after online publication and is updated daily on week days.
Initial download of the metrics may take a while.