Fig. 6
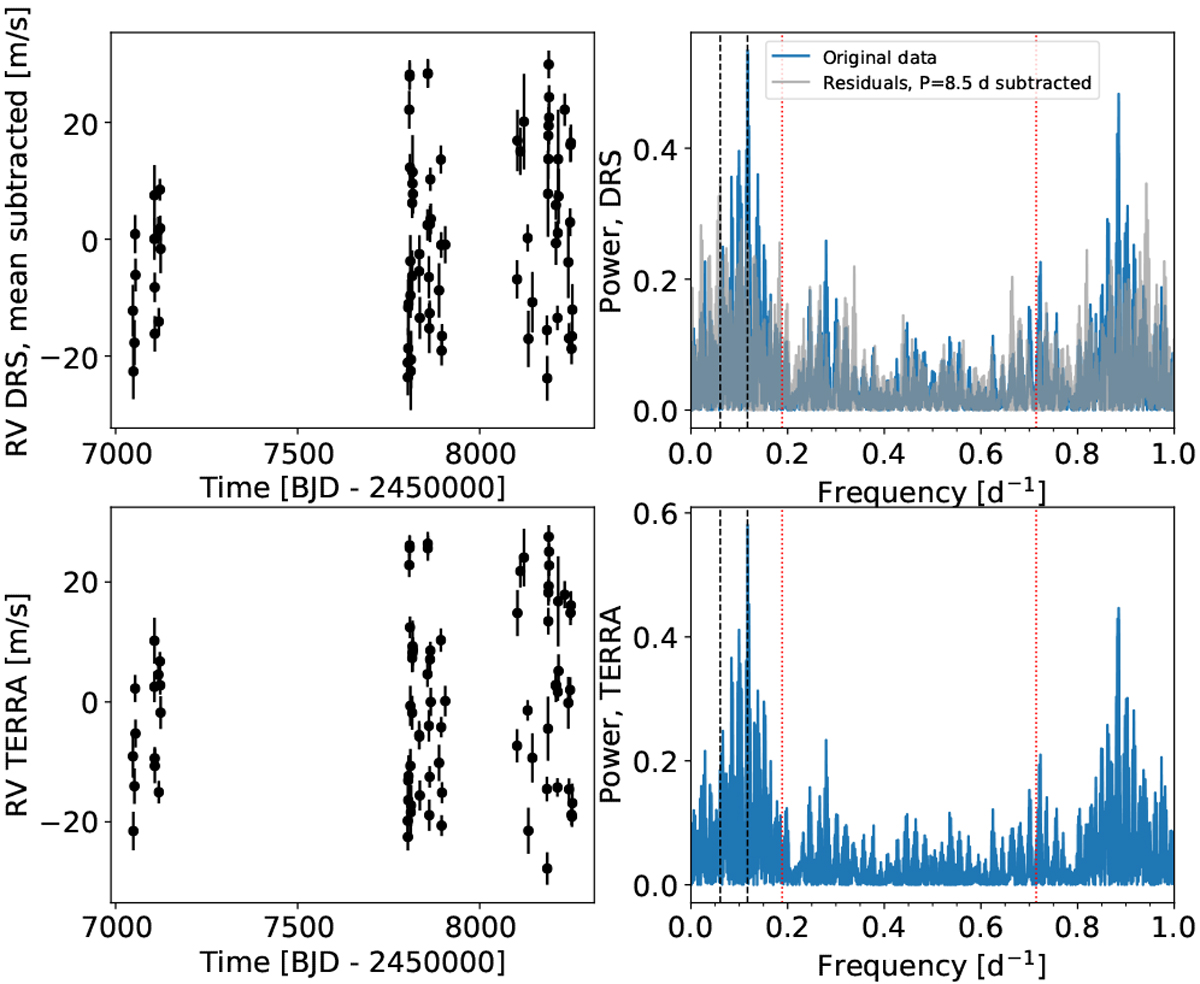
Left column: radial velocity time series extracted from HARPS-N spectra using the DRS (upper panel) and TERRA (lower panel) pipelines. Right column: GLS periodograms of the RV time series (blue line). Vertical dashed lines mark the location of the highest peak at ~8.5 days and the stellar rotation frequency, for all the datasets. Vertical dotted lines in red mark the orbital frequenciesof the K2-36 planets. For the DRS dataset only, we show the periodogram of the residuals, after subtracting the signal with period of 8.5 days (grey line), with the main peak located at P ~16.5 days, which corresponds to the stellar rotation period. The window function of the data (not shown) is the same as in Fig. 5.
Current usage metrics show cumulative count of Article Views (full-text article views including HTML views, PDF and ePub downloads, according to the available data) and Abstracts Views on Vision4Press platform.
Data correspond to usage on the plateform after 2015. The current usage metrics is available 48-96 hours after online publication and is updated daily on week days.
Initial download of the metrics may take a while.