Fig. 5
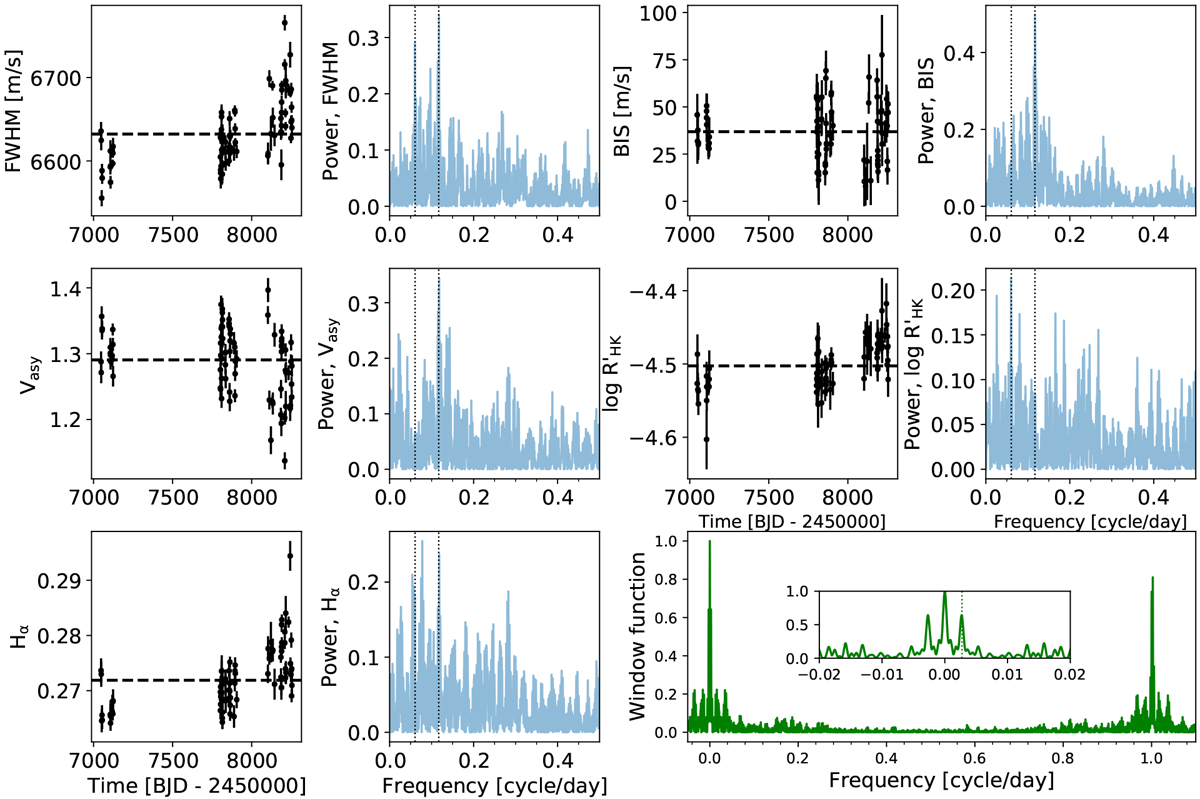
Time series of the FWHM, BIS and Vasy
CCF line diagnostics, and the log(![]() ) and Hα activity indexes, shown next to their corresponding GLS periodograms (after removing the trends in the FWHM, log(
) and Hα activity indexes, shown next to their corresponding GLS periodograms (after removing the trends in the FWHM, log(![]() ) and Hα data as described in the text). The dashed horizontal lines mark the mean values, to highlight the increasing trend visible in the FWHM, log(
) and Hα data as described in the text). The dashed horizontal lines mark the mean values, to highlight the increasing trend visible in the FWHM, log(![]() ), and Hα data. Vertical dotted lines in the periodograms mark the locations of the stellar rotation period, as derived from K2 photometry, and its first harmonic. Bottom right panel: window function of the data. A zoomed view of the low-frequency part of the spectrum is shown in the inset panel, and a vertical dotted line marks the 1-y orbital frequency of the Earth.
), and Hα data. Vertical dotted lines in the periodograms mark the locations of the stellar rotation period, as derived from K2 photometry, and its first harmonic. Bottom right panel: window function of the data. A zoomed view of the low-frequency part of the spectrum is shown in the inset panel, and a vertical dotted line marks the 1-y orbital frequency of the Earth.
Current usage metrics show cumulative count of Article Views (full-text article views including HTML views, PDF and ePub downloads, according to the available data) and Abstracts Views on Vision4Press platform.
Data correspond to usage on the plateform after 2015. The current usage metrics is available 48-96 hours after online publication and is updated daily on week days.
Initial download of the metrics may take a while.