Fig. 2
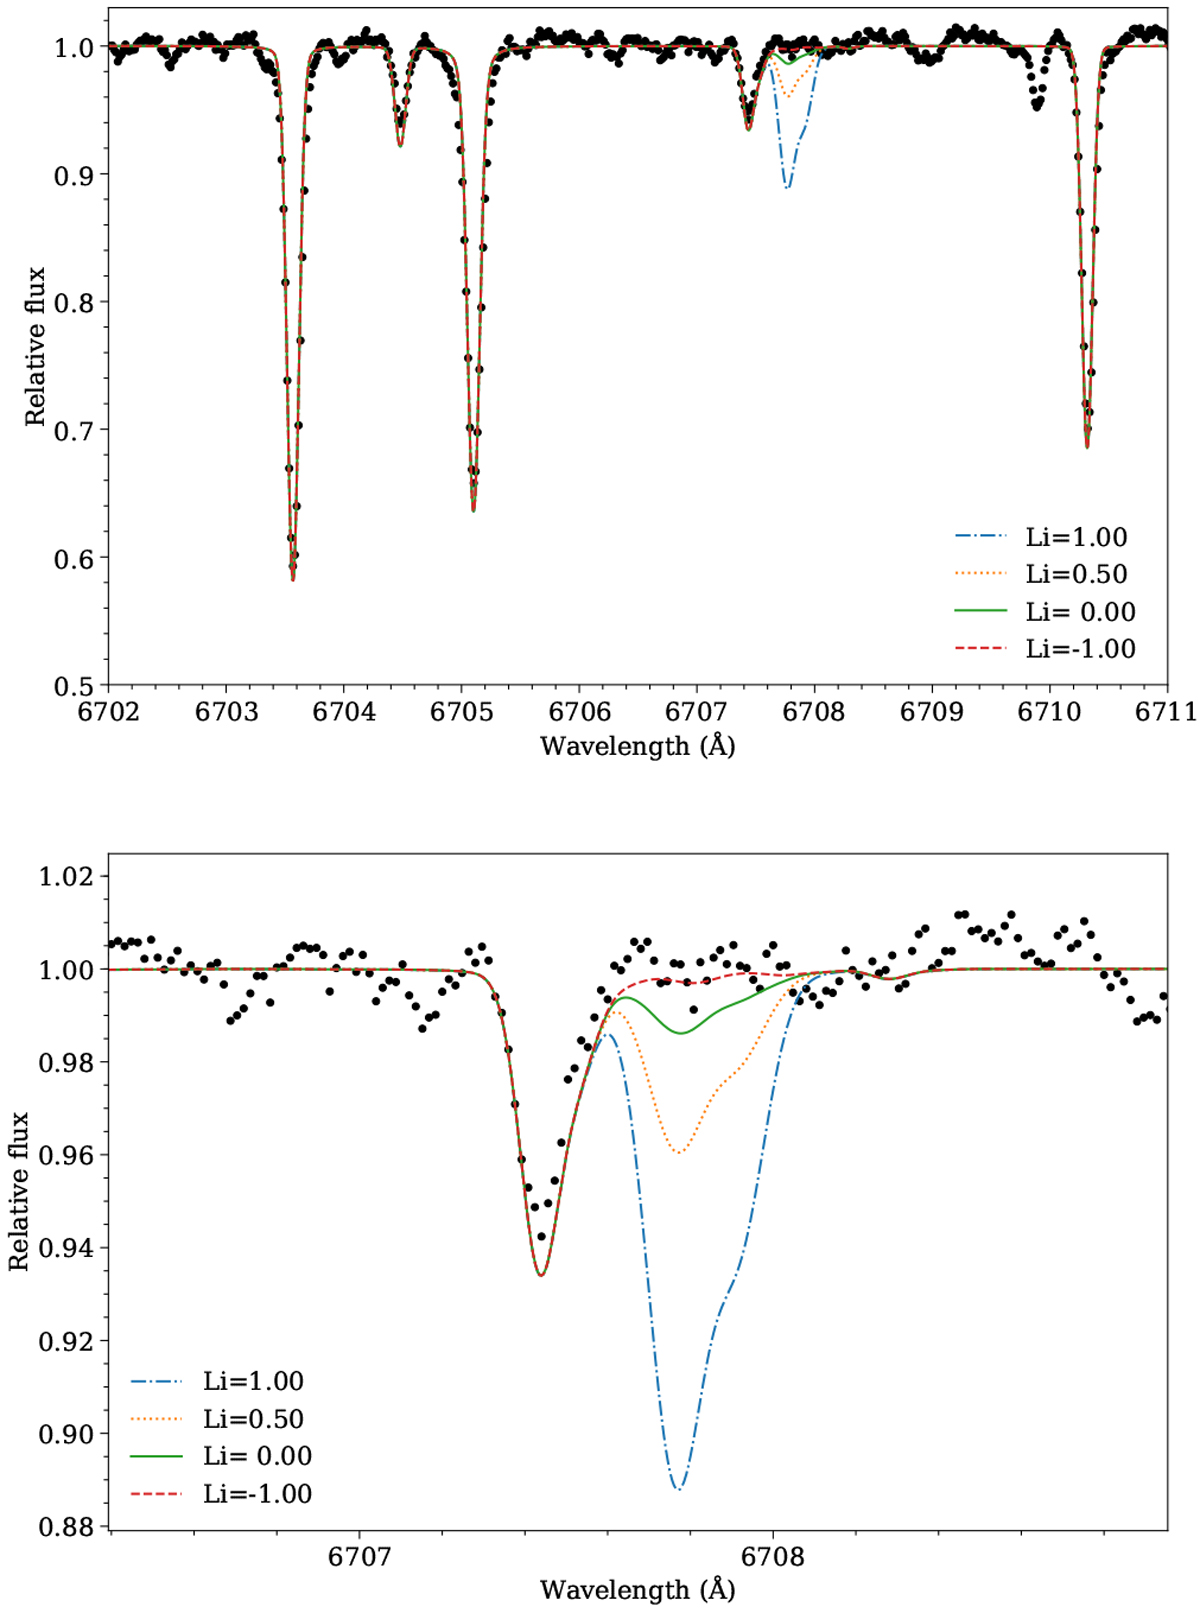
Top panel: portion of the HARPS-N co-added spectrum of K2-36 containing the LiI line at 6707.8 Å, compared to four different syntheses (lines of various colours and styles), each differing only for the assumed lithium abundance. Bottom panel: zoom-in view of the region around 6707.8 Å to enable easier comparison between the observed data and model spectra for low Li abundances.
Current usage metrics show cumulative count of Article Views (full-text article views including HTML views, PDF and ePub downloads, according to the available data) and Abstracts Views on Vision4Press platform.
Data correspond to usage on the plateform after 2015. The current usage metrics is available 48-96 hours after online publication and is updated daily on week days.
Initial download of the metrics may take a while.