Fig. 11
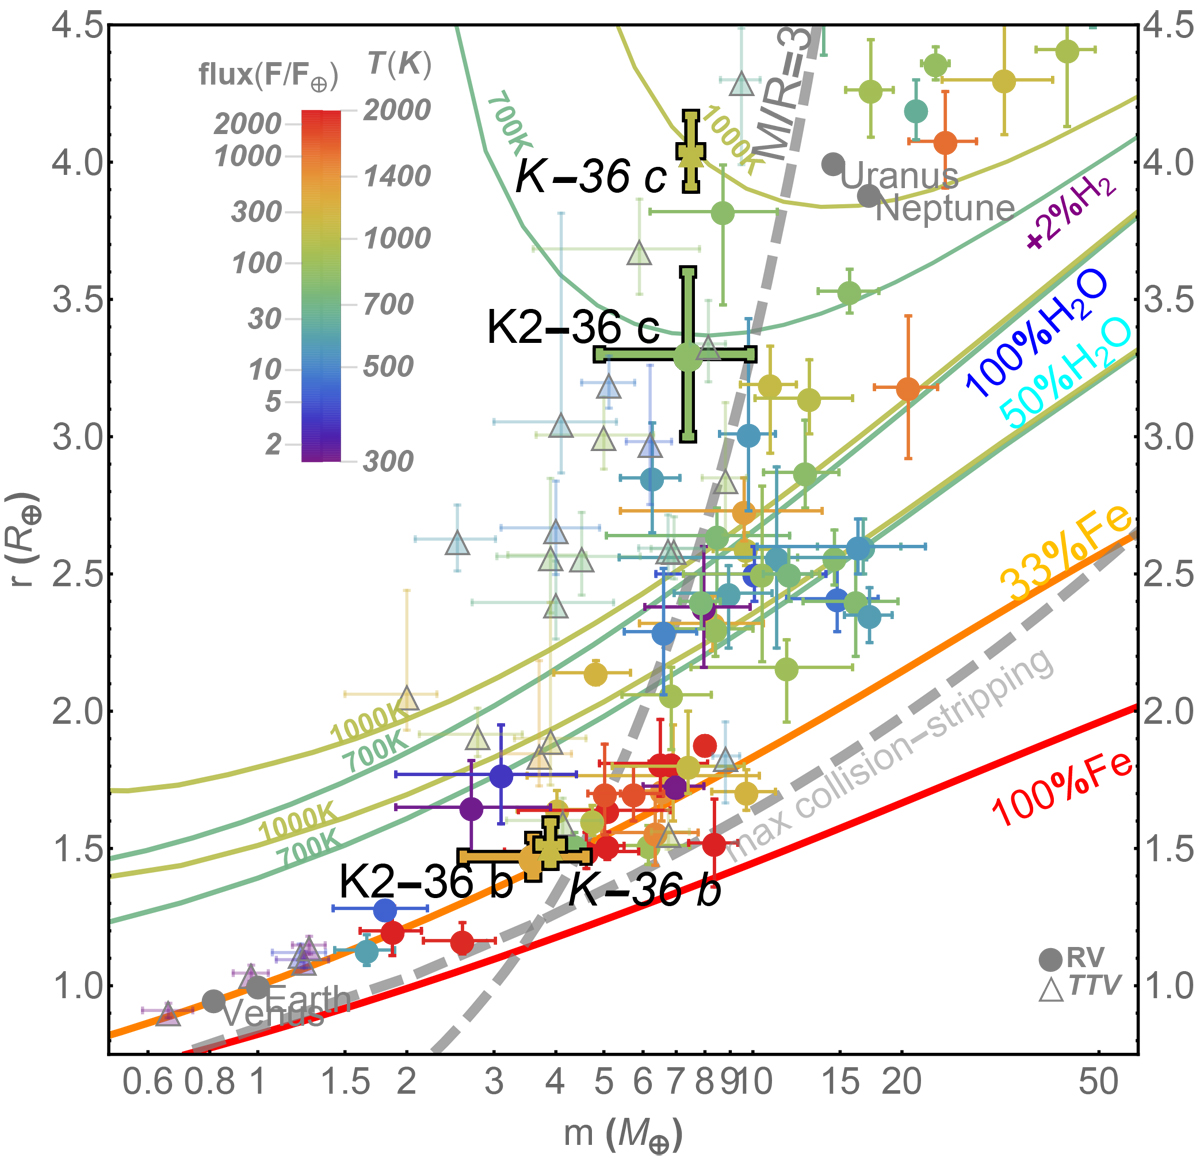
Mass–radius diagram for exoplanets with densities derived with precision better than 35% (data updated up to 2018 09 14). The planets with masses determined by the radial-velocity method are labelled as circles, and the ones with masses determined by the transit-timing-variation method are labelled as triangles. The colour of the data points denotes stellar insolation (see legend in the upper left corner) in the Earth units (expressed as either the amount of stellar bolometric radiation reaching a given area at their orbital distances, assuming negligible orbital eccentricities, normalized to the Earth’s value or surface equilibrium temperatures assuming Earth-like albedo). The plotted masses of the K2-36 planets are those derived from the GP analysis of the TERRA RV dataset. K2-36 planets are represented by filled circles in bold and explicitly labelled. Overplotted are the planets of the Kepler-36 system (filled triangles in bold labelled as K-36), showing an analogy with the K2-36 system as discussed in the text. Two sets of H2O mass–radius theoretical curves (blue – 100 mass% H2O, cyan – 50 mass% H2O; cores consist of rock and H2O ice in 1:1proportion by mass) are calculated for an isothermal fluid/steam envelope at temperatures 700 and 1000 K, sitting on top of ice VII-layer at the appropriate melting pressure. A set of mass-radius curves (upper portion of the diagram) is calculated for the same temperatures assuming the addition of an isothermal H2 -envelope (2% mass) to the top of the 50% mass H2O-rich cores. The dashed curve labelled “maximum collisional stripping” corresponds to the lower bound in radius or upper bound in density that a giant impact can yield for a given planet mass (Marcus et al. 2009). The dashed curve labelled “M/R = 3” corresponds to the contour on the mass–radius diagram where planet mass dividing by planet radius equals 3 in Earth units. It marks the equi-gravitational-potential for the surfaces of planets. Planets residing to the left of this curve are susceptible to atmospheric escape of H2 and Helium over a billion years at their current equilibrium temperatures.
Current usage metrics show cumulative count of Article Views (full-text article views including HTML views, PDF and ePub downloads, according to the available data) and Abstracts Views on Vision4Press platform.
Data correspond to usage on the plateform after 2015. The current usage metrics is available 48-96 hours after online publication and is updated daily on week days.
Initial download of the metrics may take a while.