Fig. 10
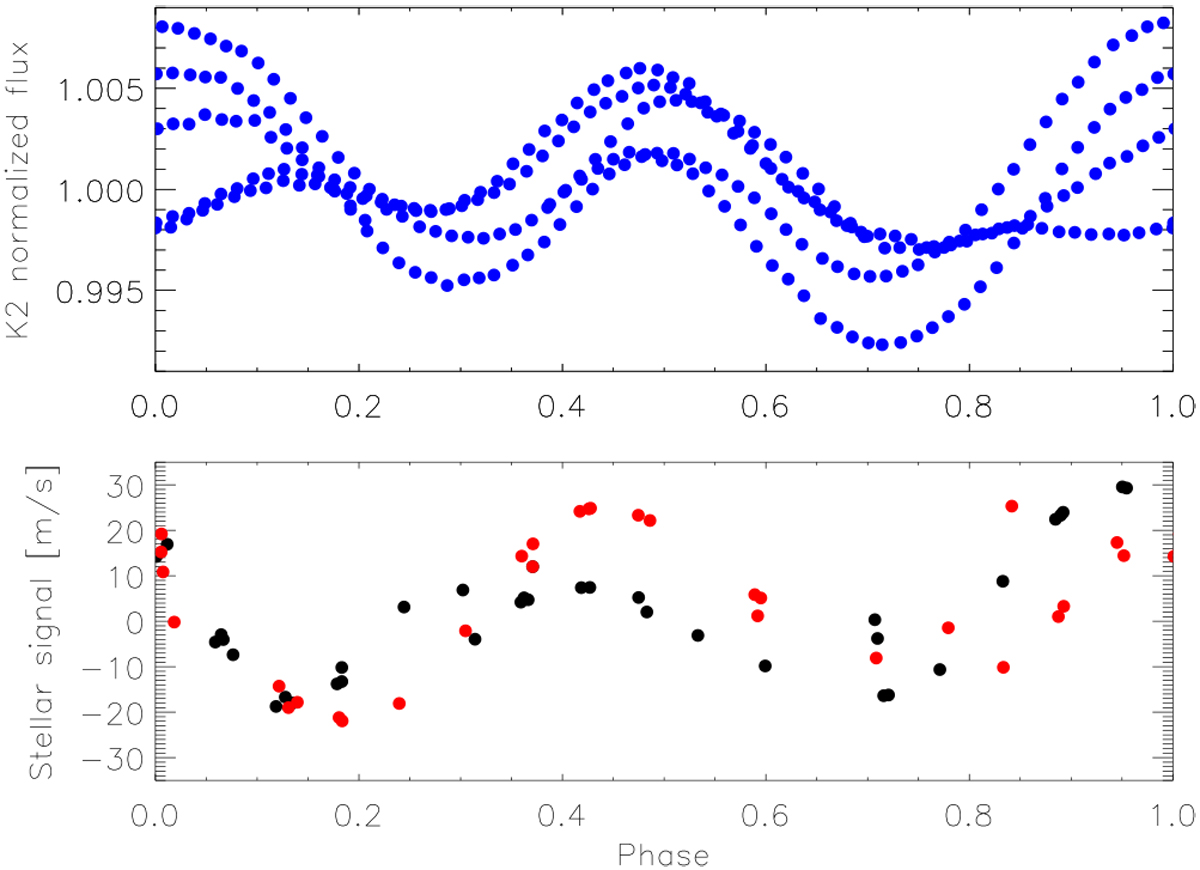
K2 light curve (upper panel) and stellar activity component in the radial velocities (lower panel; TERRA data for the last two seasons. DRS data show a similar behaviour), folded at the stellar rotation period. The reference epoch corresponding to phase = 0 is the same for both datasets. Light curve goes from May, 30th to Aug, 21st 2014 (K2 campaign C1). Spectroscopic data are distinguished according the observing season: black dots are used for data collected in 2017, red dots for those of 2018.
Current usage metrics show cumulative count of Article Views (full-text article views including HTML views, PDF and ePub downloads, according to the available data) and Abstracts Views on Vision4Press platform.
Data correspond to usage on the plateform after 2015. The current usage metrics is available 48-96 hours after online publication and is updated daily on week days.
Initial download of the metrics may take a while.