Fig. 1
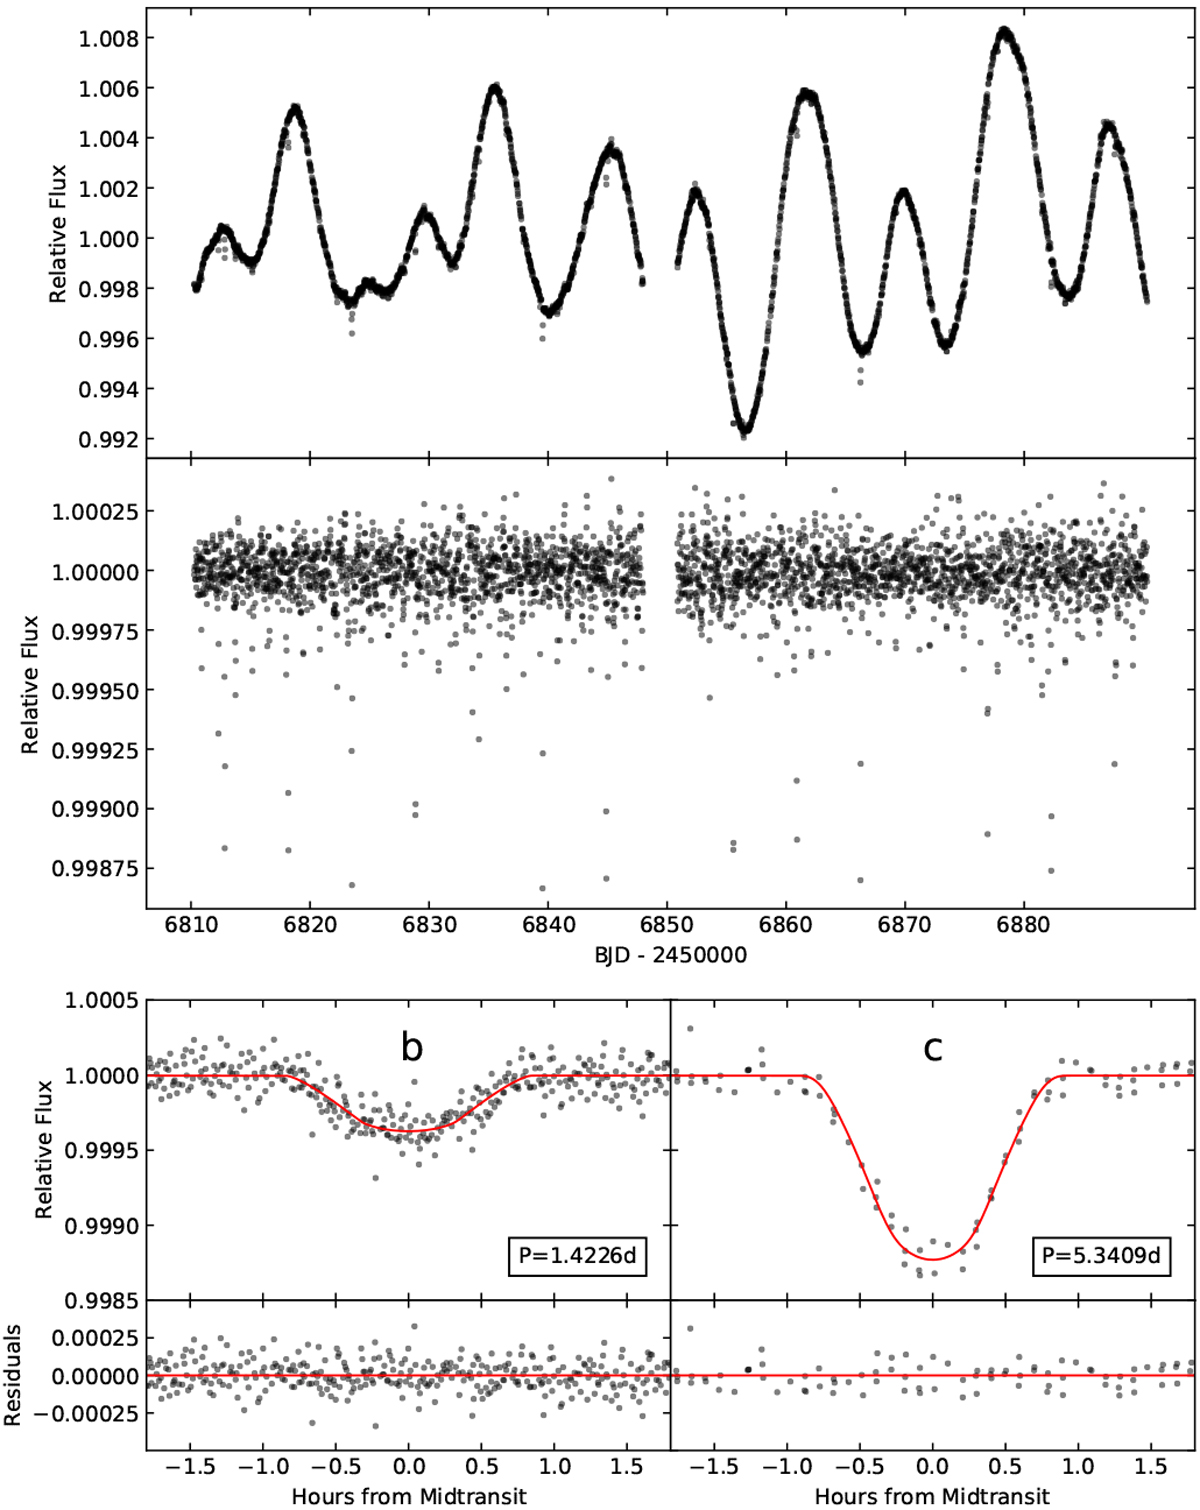
Upper panel: K2-36 light curve observed by K2, showing the modulation induced by the stellar rotation. Middle panel: K2-36 flattened light curve, with the rotation modulation filtered-out. The observed dimming events correspond to the transits of the two planets. Bottom panel: transit light curves for K2-36 b and K2-36 c folded at their best-fit orbital periods (Table 2). The curves in red are our best-fit transit models, and the residuals are also shown.
Current usage metrics show cumulative count of Article Views (full-text article views including HTML views, PDF and ePub downloads, according to the available data) and Abstracts Views on Vision4Press platform.
Data correspond to usage on the plateform after 2015. The current usage metrics is available 48-96 hours after online publication and is updated daily on week days.
Initial download of the metrics may take a while.