Fig. 6
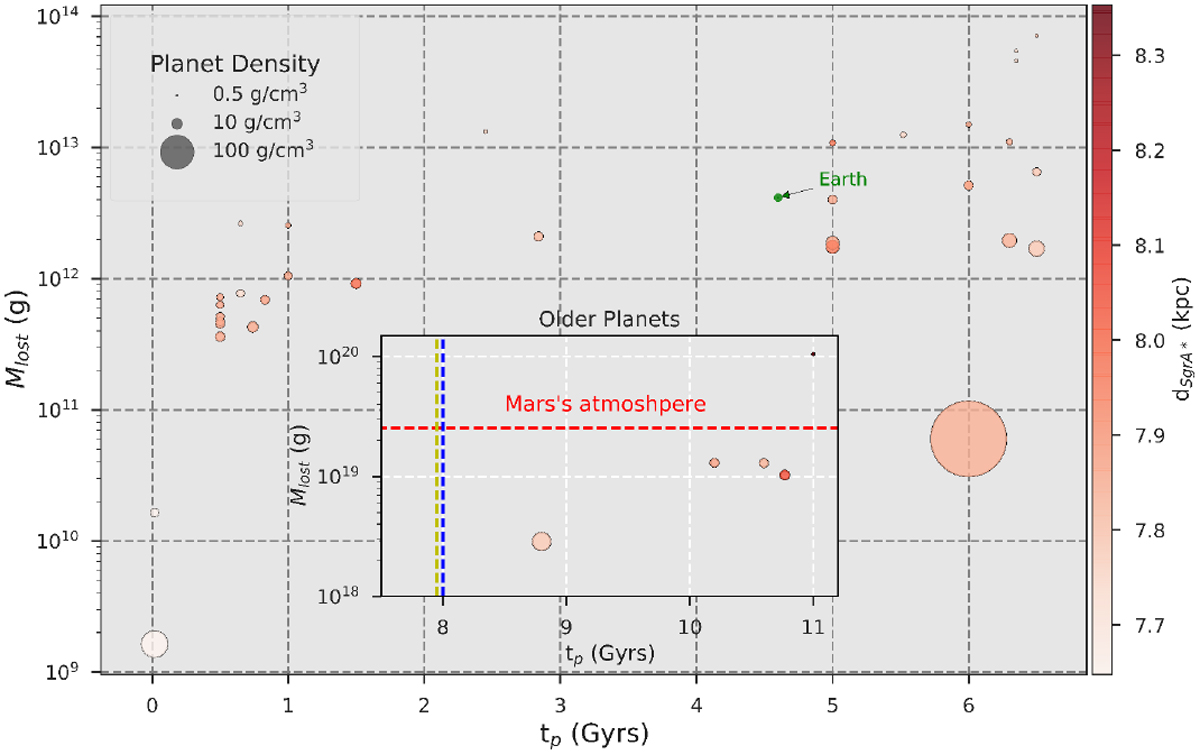
Total mass loss experienced by the EPs in their lifetime as a function of age, with ɛ = 0.1 main plot, the total mass lost by the younger EPs sample, inset subplot, total mass loss experienced by the older EPs. In the inset subplot, the blue dashed line marks the onset of the AGN phase of Sgr A* 8 Gyr ago, the yellow dashed line represents the end of its activity 7.95 Gyr ago, and the red dashed line signifies the mass of the Mars atmosphere. The color of the data points is indicative of the distance of the planet to Sgr A*.
Current usage metrics show cumulative count of Article Views (full-text article views including HTML views, PDF and ePub downloads, according to the available data) and Abstracts Views on Vision4Press platform.
Data correspond to usage on the plateform after 2015. The current usage metrics is available 48-96 hours after online publication and is updated daily on week days.
Initial download of the metrics may take a while.