Free Access
Fig. 3
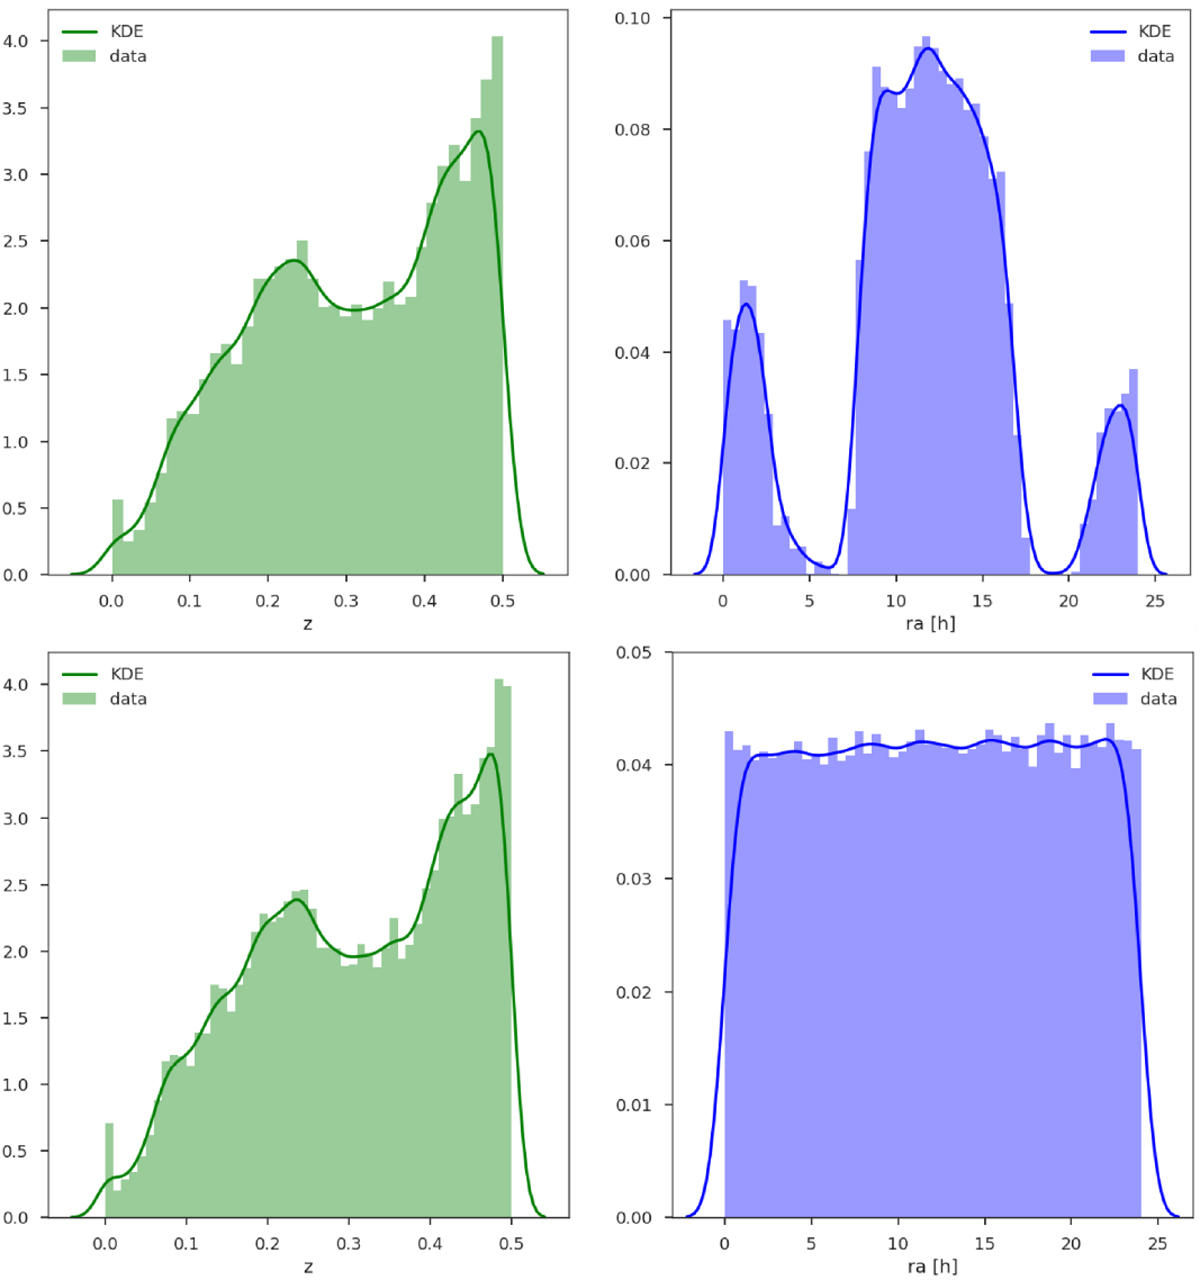
z and RA KDEs for the SDSS (top panels) and the generated (bottom panels) samples of AGNs. The distinct dips, due to the lack of data from these regions of the sky, can be seen in the RA KDE (top). Based on the SDSS sample distribution, we generated a new full-sky sample, with an assumed isotropic distribution (bottom).
Current usage metrics show cumulative count of Article Views (full-text article views including HTML views, PDF and ePub downloads, according to the available data) and Abstracts Views on Vision4Press platform.
Data correspond to usage on the plateform after 2015. The current usage metrics is available 48-96 hours after online publication and is updated daily on week days.
Initial download of the metrics may take a while.