Fig. 8.
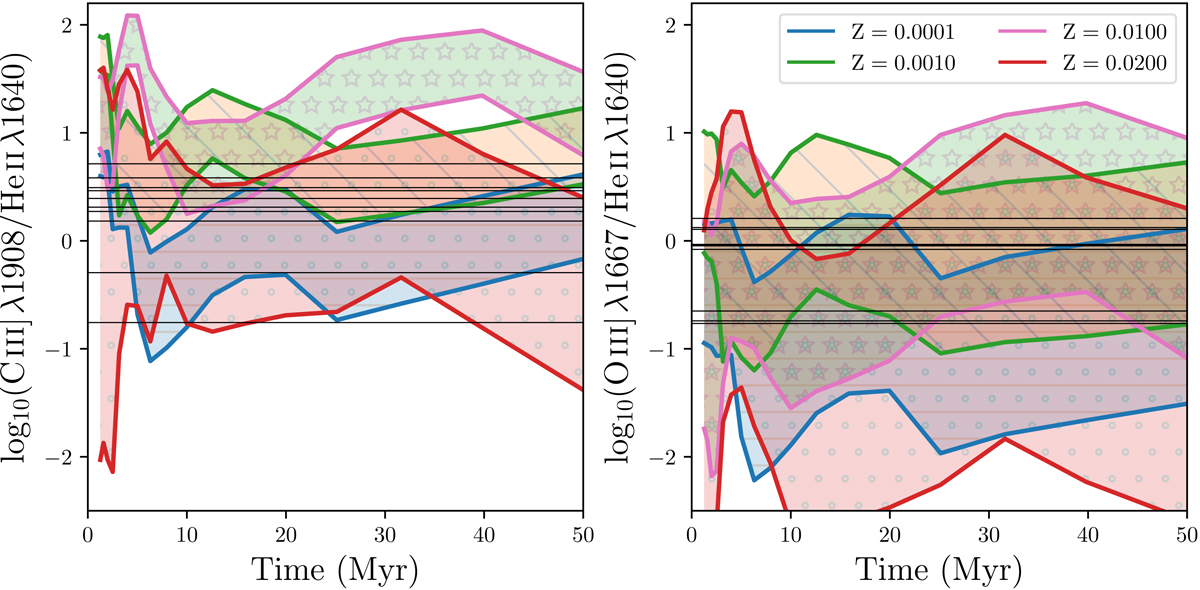
Rest-frame UV emission line ratios of the MUSE He II λ1640 sample compared with the model line ratios computed by Xiao et al. (2018) using BPASS binary stellar population models. Here we show the C III]/He II λ1640 vs. O III]/He II λ1640 line ratios for the MUSE He II λ1640 detected sample. Individual galaxies with S/N ≥ 2.5 for all three emission lines are shown as stars. Galaxies that fail the S/N cut are shown as arrows. The symbol size is proportional to the age from the onset of the star formation burst between t = 1 Myr (smallest) and t = 50 Myr. Models are computed with log10(nH)=1.0 with varying Us between −2.5 and −1.5. BPASS Z⊙ = 0.02.
Current usage metrics show cumulative count of Article Views (full-text article views including HTML views, PDF and ePub downloads, according to the available data) and Abstracts Views on Vision4Press platform.
Data correspond to usage on the plateform after 2015. The current usage metrics is available 48-96 hours after online publication and is updated daily on week days.
Initial download of the metrics may take a while.