Fig. 7.
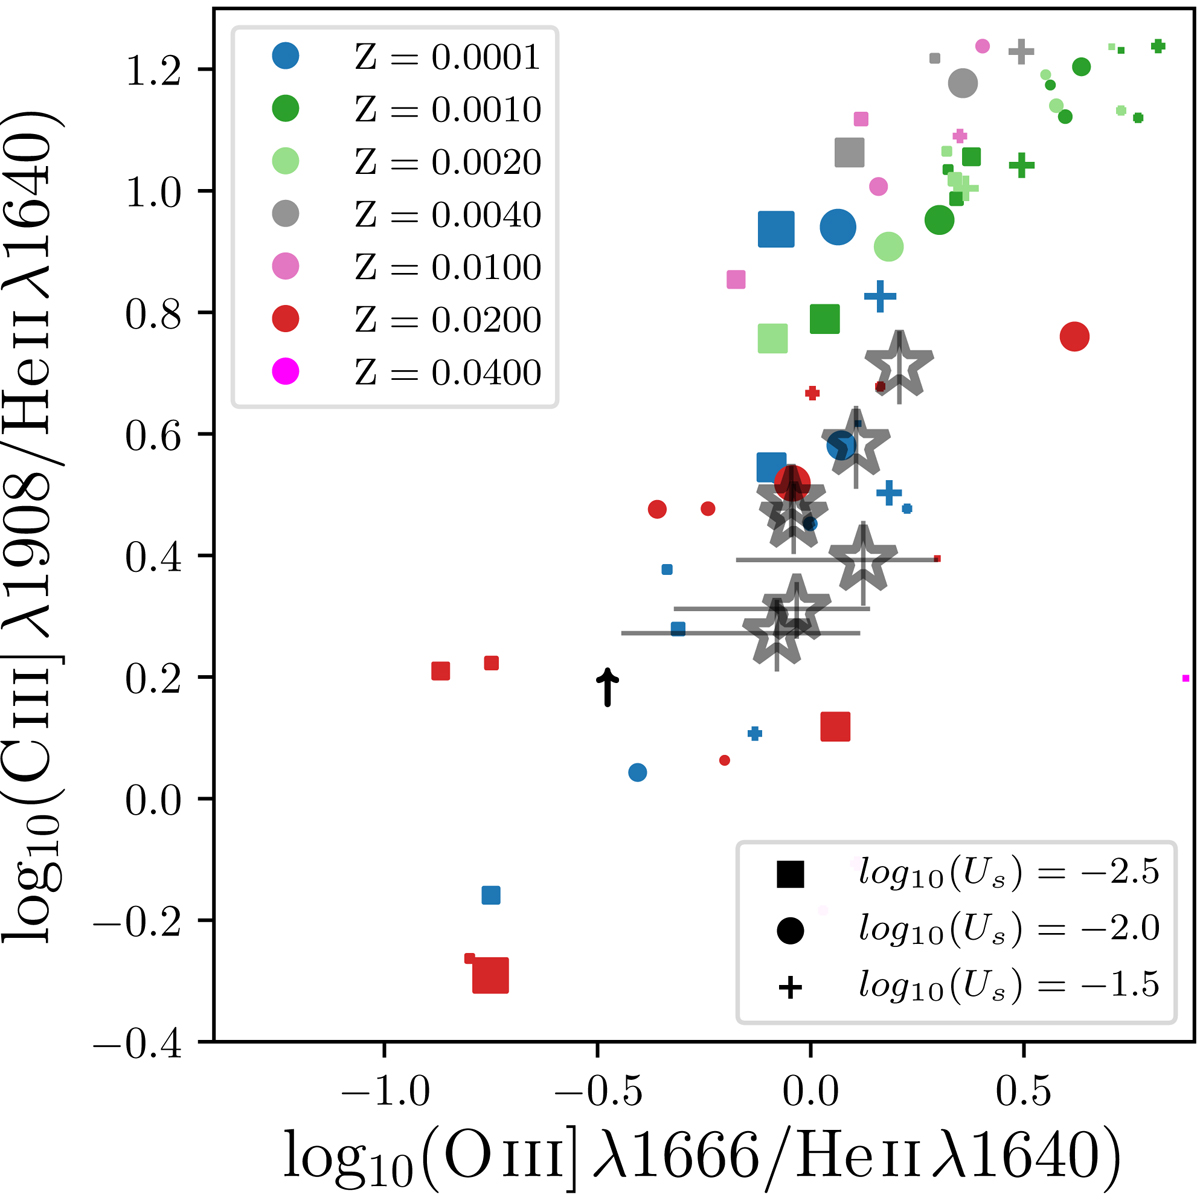
Rest-frame UV emission line ratios of the MUSE stacked galaxies compared with the Gutkin et al. (2016) models. Panels from left to right are similar to Fig. 6. Galaxies are stacked in mass and redshift bins, and the line width of the markers increases with mass and redshift. Limits resemble stacks with emission lines (considered in each panel) lower than the 3σ error limit. For such stacks, 3σ error is used as the respective line flux. Top panel: MUSE-stacked sample for stellar mass bins log10(M*/M⊙) < 9.5, 9.5 < log10(M*/M⊙) < 10.0, and log10(M*/M⊙) > 10.0. Bottom panel: MUSE-stacked sample for redshift bins z < 2.5, 2.5 < z < 3, and z > 3.
Current usage metrics show cumulative count of Article Views (full-text article views including HTML views, PDF and ePub downloads, according to the available data) and Abstracts Views on Vision4Press platform.
Data correspond to usage on the plateform after 2015. The current usage metrics is available 48-96 hours after online publication and is updated daily on week days.
Initial download of the metrics may take a while.