Fig. 6.
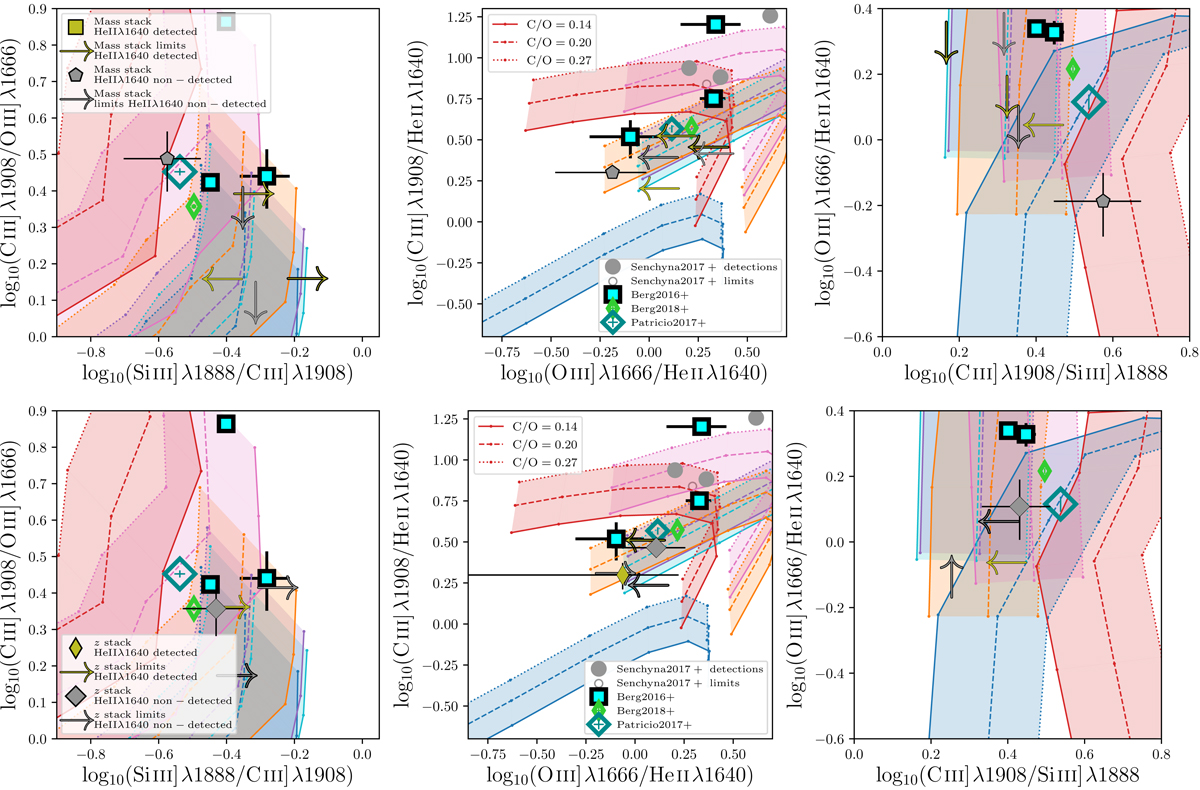
Rest-frame UV emission line ratios of the MUSE He II λ1640 sample. Left panel: C III]/O III] vs. Si III]/C III] ratios. Individual galaxies with S/N > 2.5 for all four emission lines are shown as stars. Limits are shown as arrows. The tracks are from the Gutkin et al. (2016) models, which are powered by star-formation. Each set of tracks with the same colour show three C/O ratios, and the regions between the minimum and maximum C/O tracks are shaded by the same colour. From top to bottom, the ionisation parameter ncreases. Where available, line ratios from Patrício et al. (2016), Senchyna et al. (2017), and Berg et al. (2018) are shown for comparison. MUSE line ratios of the Lyman continuum emitting candidate from Naidu et al. (2017) are shown by the filled green star. Centre panel: similar to the left panel, but C III]/He II λ1640 vs. O III]/He II λ1640 emission line ratios, where detections are defined as galaxies with S/N > 2.5 for all three emission lines. Right panel: similar to the left panel, but O III]/He II λ1640 vs. C III]/Si III] emission line ratios, where detections are defined as galaxies with S/N > 2.5 for all four emission lines.
Current usage metrics show cumulative count of Article Views (full-text article views including HTML views, PDF and ePub downloads, according to the available data) and Abstracts Views on Vision4Press platform.
Data correspond to usage on the plateform after 2015. The current usage metrics is available 48-96 hours after online publication and is updated daily on week days.
Initial download of the metrics may take a while.