Fig. 3.
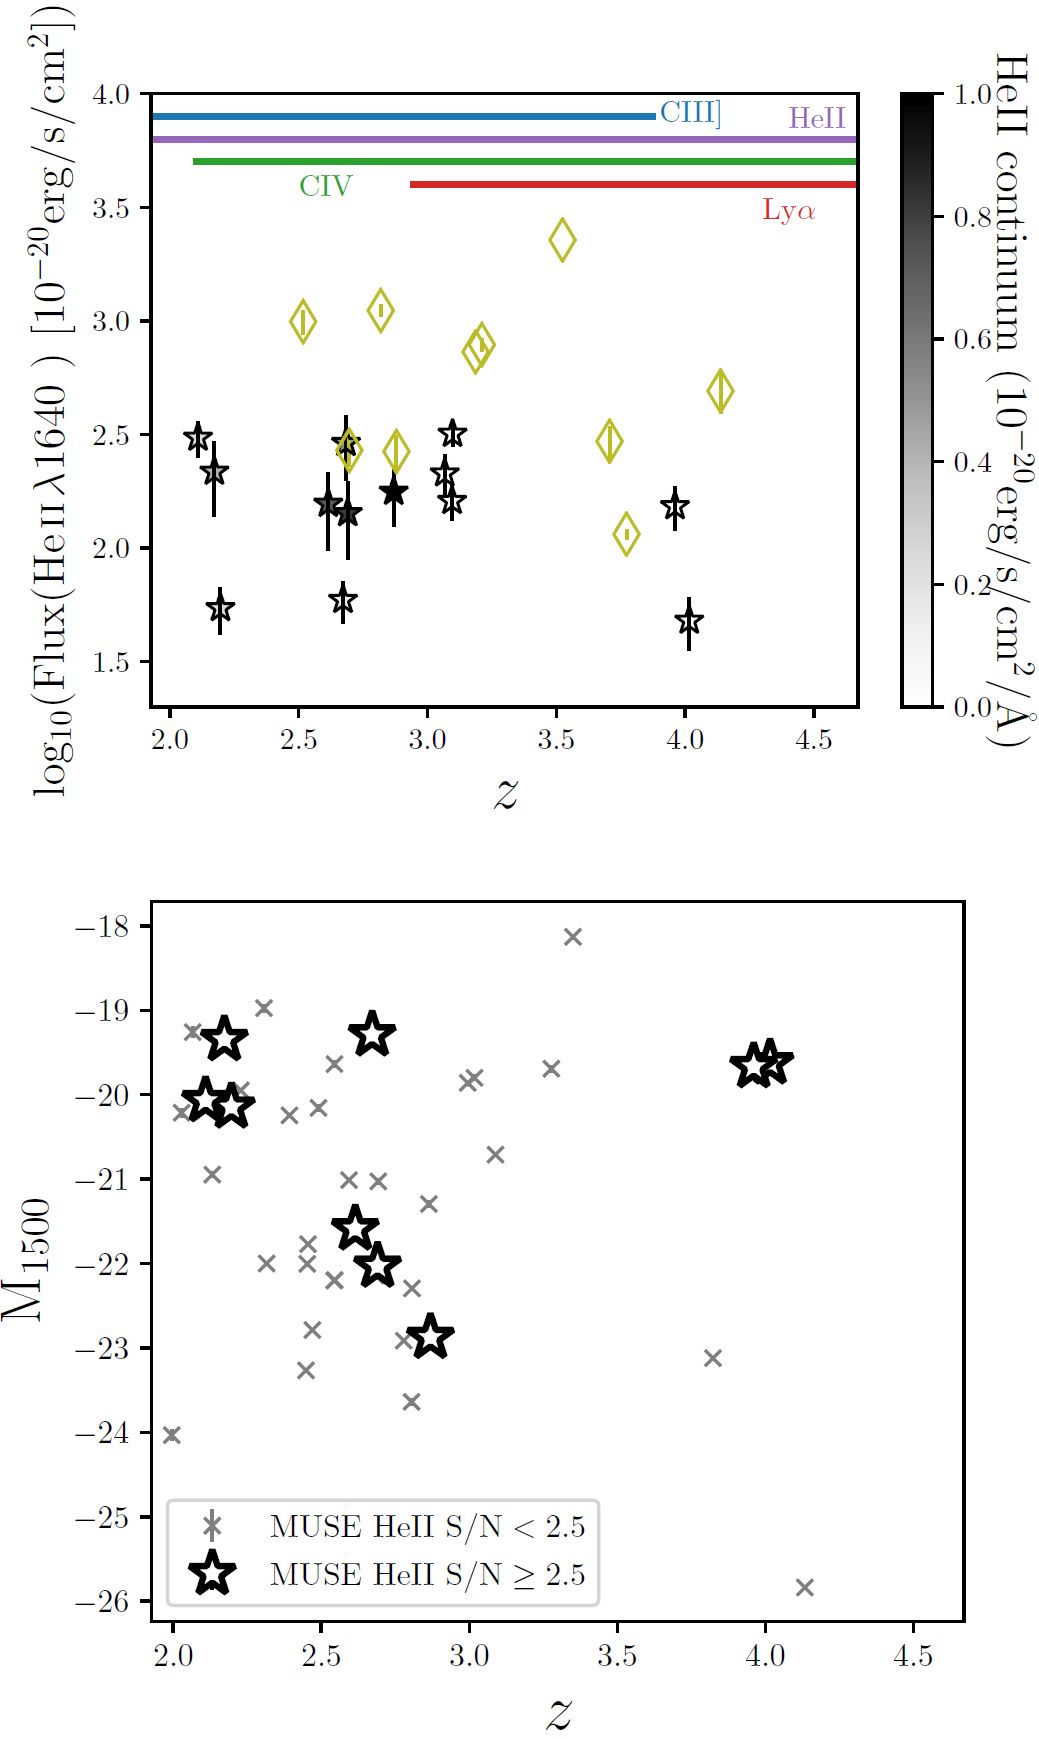
Top panel: He II λ1640 flux as a function of redshift. He II λ1640 detections from MUSE are shown as stars and are colour-coded depending on their median continuum flux at ∼1640 Å. He II λ1640 detections from other surveys within the plot range are shown by diamonds. The redshift-dependent MUSE wavelength coverage of a few prominent rest-UV features are shown at the top of the panel. Bottom panel: M1500 as a function of redshift for the MUSE He II λ1640 detected and He II λ1640 non-detected galaxies (set B, see Sect. 3.2).
Current usage metrics show cumulative count of Article Views (full-text article views including HTML views, PDF and ePub downloads, according to the available data) and Abstracts Views on Vision4Press platform.
Data correspond to usage on the plateform after 2015. The current usage metrics is available 48-96 hours after online publication and is updated daily on week days.
Initial download of the metrics may take a while.