Fig. 2.
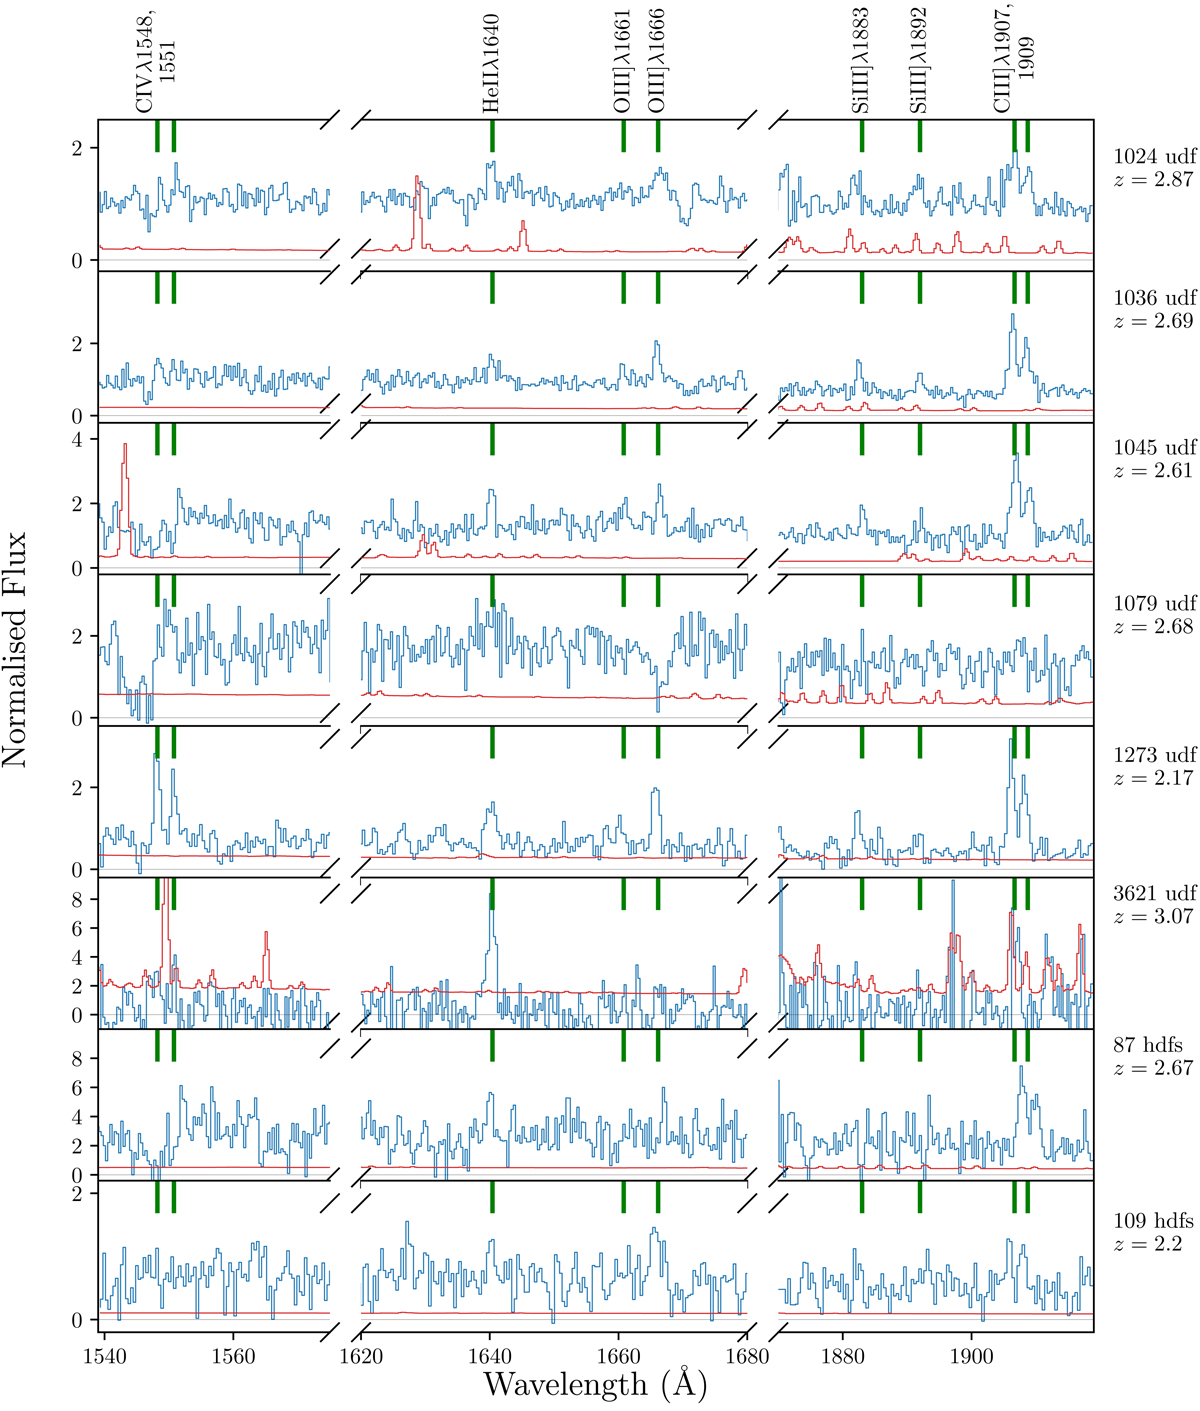
Spectra (blue) of the MUSE He II λ1640 detections with their respective noise spectrum (red). All spectra are shown at their rest-frame wavelength and are normalised at ∼1600 Å. The ID, field, and the spectroscopic redshift of each target is shown in the panels. The green vertical lines indicate selected rest-UV emission and absorption features.
Current usage metrics show cumulative count of Article Views (full-text article views including HTML views, PDF and ePub downloads, according to the available data) and Abstracts Views on Vision4Press platform.
Data correspond to usage on the plateform after 2015. The current usage metrics is available 48-96 hours after online publication and is updated daily on week days.
Initial download of the metrics may take a while.