Fig. 11.

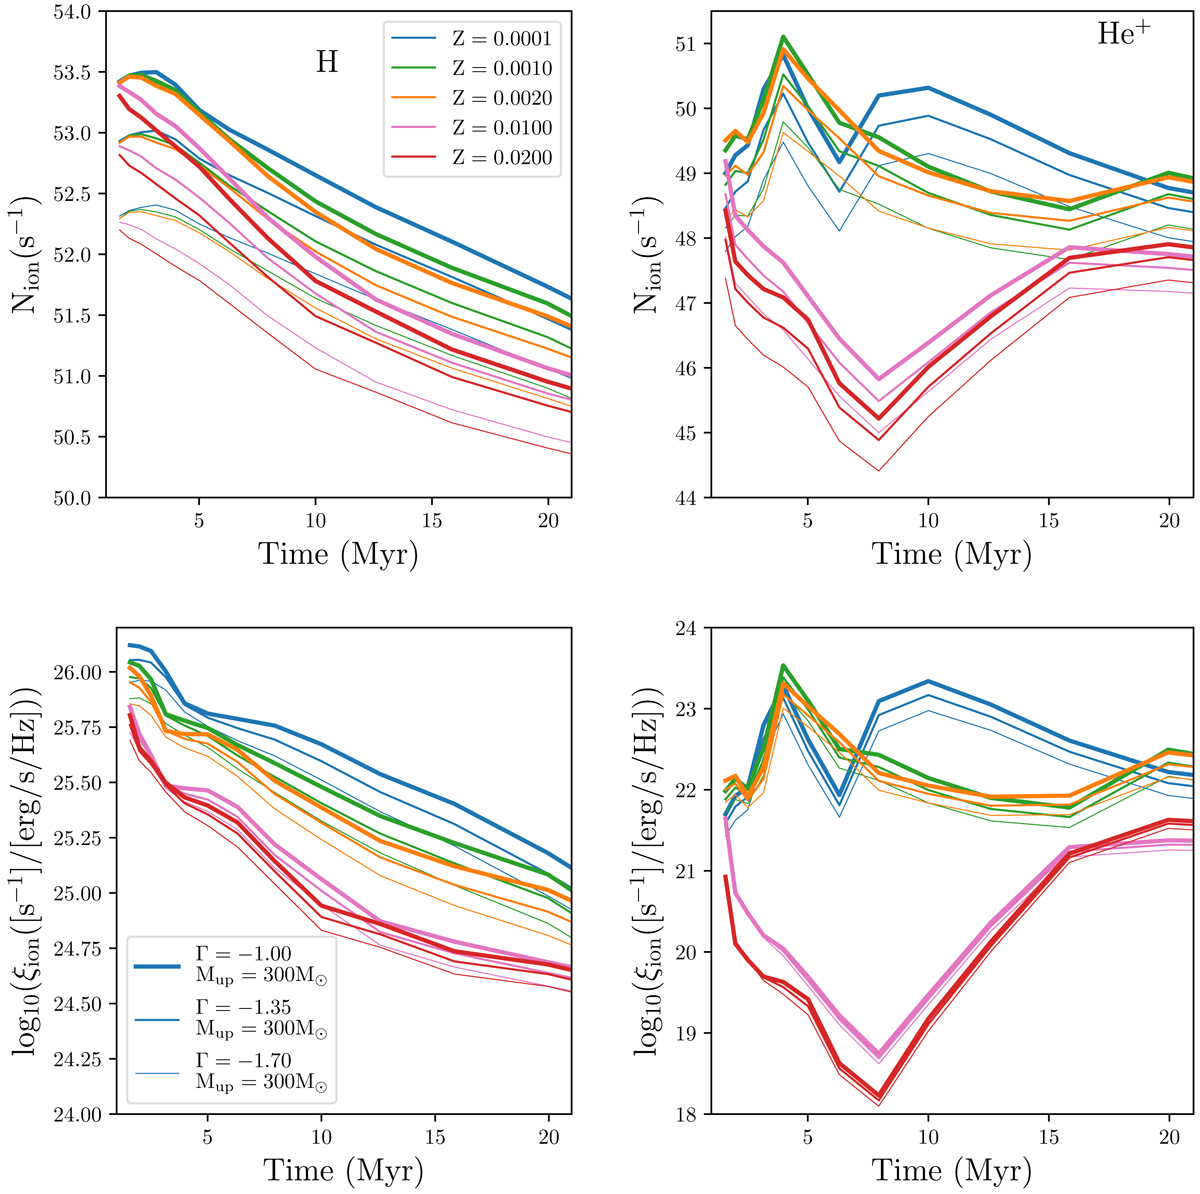
Left panel: example BPASS v2.1 model spectra of a single-burst stellar population after 5 Myr from the star burst. The single (dashed) and binary (continuous) model predictions are shown for different IMFs (Γ = −1.0, −1.35, −1.70) with a high-mass IMF cutoff at 300 M⊙. The dashed black vertical lines mark λ = 228 Å, 353 Å, 508 Å, and 912 Å, below which He+, O++, C++, and H ionising photons are produced. Right panel: zoomed-in region λ < 275Å clearly showing the difference in flux around He+ ionising limits.
Current usage metrics show cumulative count of Article Views (full-text article views including HTML views, PDF and ePub downloads, according to the available data) and Abstracts Views on Vision4Press platform.
Data correspond to usage on the plateform after 2015. The current usage metrics is available 48-96 hours after online publication and is updated daily on week days.
Initial download of the metrics may take a while.


