Fig. 9.
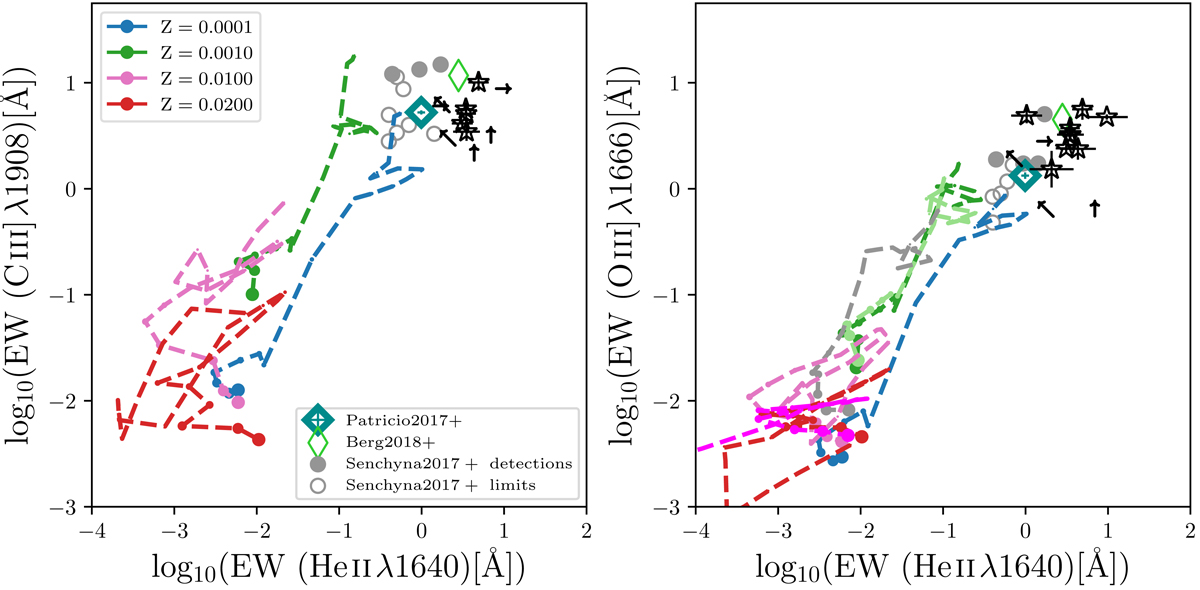
Xiao et al. (2018) rest-UV emission line ratio evolution as a function of time. Here we show in the left panel C III]/He II λ1640 vs. time and in the right panel O III]λ1666/He II λ1640 vs. time for the BPASS binary models computed with a log10(nH)=1.0 and Us = −1.5 and Us = −3.5 (upper and lower limits of each shaded region, respectively) at different metallicities between 1 Z⊙ and 1/200th Z⊙. We only show a limited set of model metallicities for clarity. The black horizontal lines show the line ratios of the MUSE He II λ1640 sample.
Current usage metrics show cumulative count of Article Views (full-text article views including HTML views, PDF and ePub downloads, according to the available data) and Abstracts Views on Vision4Press platform.
Data correspond to usage on the plateform after 2015. The current usage metrics is available 48-96 hours after online publication and is updated daily on week days.
Initial download of the metrics may take a while.