Fig. 1.
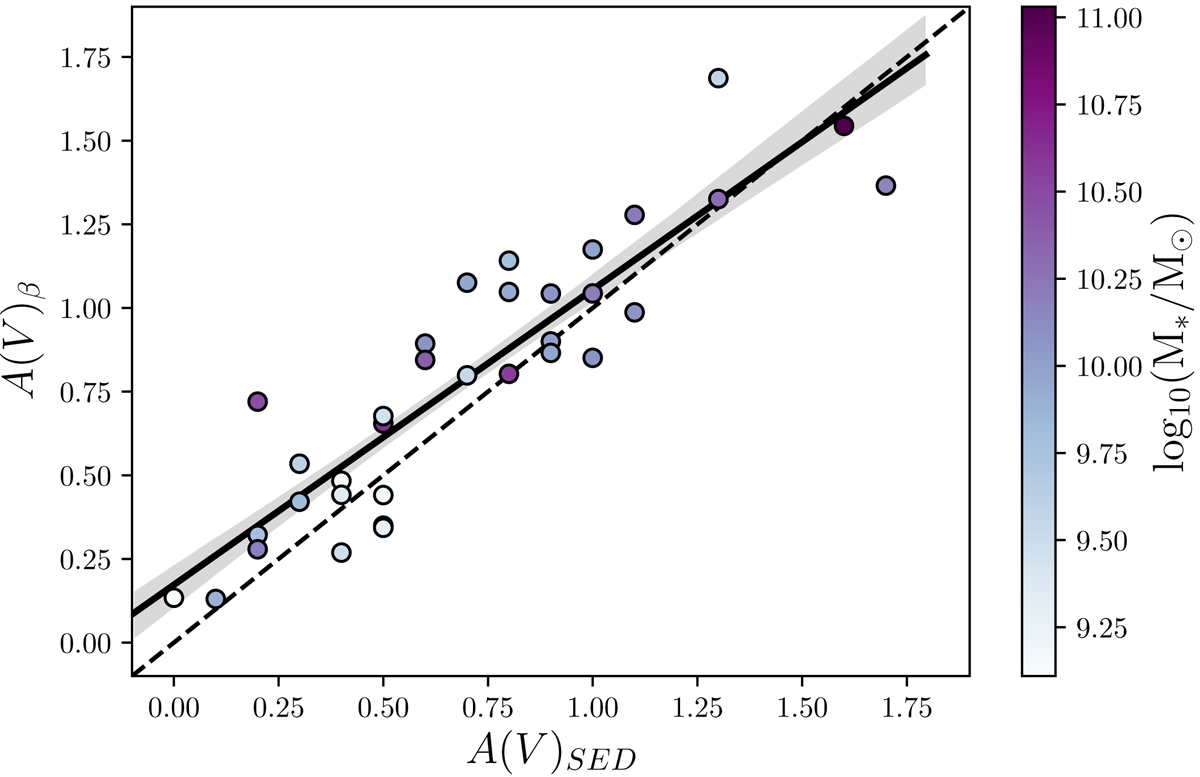
Comparison between A(V)β and A(V)SED. Galaxies from MUSE UDF with CONFID = 3 and z = 2.2 − 4.7 with continuum S/N ≳ 3 are shown here and are colour-coded by their mass. The one-to-one line is shown as a black dashed line. The solid black line shows the linear regression model fit to the data along with its 1σ uncertainty (computed using 1000 bootstrap resamples) shaded in grey.
Current usage metrics show cumulative count of Article Views (full-text article views including HTML views, PDF and ePub downloads, according to the available data) and Abstracts Views on Vision4Press platform.
Data correspond to usage on the plateform after 2015. The current usage metrics is available 48-96 hours after online publication and is updated daily on week days.
Initial download of the metrics may take a while.