| Issue |
A&A
Volume 624, April 2019
|
|
|---|---|---|
| Article Number | A121 | |
| Number of page(s) | 17 | |
| Section | Planets and planetary systems | |
| DOI | https://doi.org/10.1051/0004-6361/201834541 | |
| Published online | 24 April 2019 | |
The shape of (7) Iris as evidence of an ancient large impact?★,★★
1
Institute of Astronomy, Charles University, Prague,
V Holešovičkách 2,
18000
Prague 8, Czech Republic
e-mail: This email address is being protected from spambots. You need JavaScript enabled to view it.
; This email address is being protected from spambots. You need JavaScript enabled to view it.
2
Department of Earth, Atmospheric and Planetary Sciences, MIT,
77 Massachusetts Avenue,
Cambridge,
MA 02139, USA
3
Astrophysics Research Centre, Queen’s University, Belfast
BT7 1NN, UK
4
Aix Marseille Université, CNRS, LAM, Laboratoire d’Astrophysique de Marseille, Marseille,
France
5
Department of Mathematics, Tampere University of Technology,
PO Box 553,
33101
Tampere, Finland
6
Université Côte d’Azur, Observatoire de la Côte d’Azur, CNRS, Laboratoire Lagrange,
Nice, France
7
ONERA, The French Aerospace Lab BP72, 29 avenue de la Division Leclerc, 92322 Chatillon Cedex, France
8
SETI Institute, Carl Sagan Center,
189 Bernado Avenue,
Mountain View, CA 94043, USA
9
IMCCE, Observatoire de Paris,
77 Avenue Denfert-Rochereau,
75014 Paris Cedex, France
10
Astronomical Observatory Institute, Faculty of Physics, Adam Mickiewicz University,
Słoneczna 36,
60-286 Poznań,
Poland
11
Institute of Physics, University of Szczecin,
Wielkopolska 15,
70-453 Szczecin,
Poland
12
Space Sciences, Technologies and Astrophysics Research Institute, Université de Liège,
Allée du 6 Août 17,
4000 Liège, Belgium
13
Open University, School of Physical Sciences, The Open University, Milton Keynes MK7 6AA, UK
14
Jet Propulsion Laboratory, California Institute of Technology,
4800 Oak Grove Drive,
Pasadena,
CA 91109, USA
15
European Space Agency, ESTEC – Scientific Support Office,
Keplerlaan 1,
Noordwijk 2200 AG, The Netherlands
16
TMT Observatory,
100 West Walnut Street, Suite 300,
Pasadena,
CA 91124, USA
17
Sección Física, Departamento de Ciencias, Pontificia Universidad Católica del Perú,
Apartado, Lima 1761, Peru
18
European Southern Observatory (ESO),
Alonso de Cordova 3107,
1900 Casilla Vitacura, Santiago, Chile
Received:
30
October
2018
Accepted:
13
February
2019
Abstract
Context. Asteroid (7) Iris is an ideal target for disk-resolved imaging owing to its brightness (V ~ 7–8) and large angular size of 0.33′′ during its apparitions. Iris is believed to belong to the category of large unfragmented asteroids that avoided internal differentiation, implying that its current shape and topography may record the first few 100 Myr of the solar system’s collisional evolution.
Aims. We recovered information about the shape and surface topography of Iris from disk-resolved VLT/SPHERE/ZIMPOL images acquired in the frame of our ESO large program.
Methods. We used the All-Data Asteroid Modeling (ADAM) shape reconstruction algorithm to model the 3D shape of Iris, using optical disk-integrated data and disk-resolved images from SPHERE and earlier AO systems as inputs. We analyzed the SPHERE images and our model to infer the asteroid’s global shape and the morphology of its main craters.
Results. We present the 3D shape, volume-equivalent diameter Deq = 214 ± 5 km, and bulk density ρ = 2.7 ± 0.3 g cm−3 of Iris. Its shape appears to be consistent with that of an oblate spheroid with a large equatorial excavation. We identified eight putative surface features 20–40 km in diameter detected at several epochs, which we interpret as impact craters, and several additional crater candidates. Craters on Iris have depth-to-diameter ratios that are similar to those of analogous 10 km craters on Vesta.
Conclusions. The bulk density of Iris is consistent with that of its meteoritic analog based on spectroscopic observations, namely LL ordinary chondrites. Considering the absence of a collisional family related to Iris and the number of large craters on its surface, we suggest that its equatorial depression may be the remnant of an ancient (at least 3 Gyr) impact. Iris’s shape further opens the possibility that large planetesimals formed as almost perfect oblate spheroids. Finally, we attribute the difference in crater morphology between Iris and Vesta to their different surface gravities, and the absence of a substantial impact-induced regolith on Iris.
Key words: minor planets, asteroids: individual: 7 Iris / methods: observational / methods: numerical
The reduced images are only available at the CDS via anonymous ftp to cdsarc.u-strasbg.fr (130.79.128.5) or via http://cdsarc.u-strasbg.fr/viz-bin/qcat?J/A+A/624/A121
Based on observations made with ESO Telescopes at the Paranal Observatory under programme ID 199.C-0074 (PI: P. Vernazza) and 086.C-0785 (PI: B. Carry).
© ESO 2019
1 Introduction
The largest asteroids (typically with D ≥ 200 km) are ideal targets for investigating the collisional history of the asteroid belt. Their outer shell has witnessed 4.6 Gyr of collisions, contrary to that of smaller asteroids, which are fragments of once larger bodies (Morbidelli et al. 2009). The outer shell and overall shape of many of the large bodies, however, has been affected by external processes (such as impacts) and by internal processes via the radioactive decay of 26Al. During the first 100 Myr that followed their formation, this early heat source generated enough energy to melt/fluidify their interiors, relax their shapes and surface topography, and erase their primordial cratering records. Like the terrestrial planets, these bodies (including (1) Ceres and (4) Vesta) do not thus offer the possibility to decode the early collisional environment of the solar system (≤50–200 Myr after solar system formation). More specifically, Fu et al. (2014) found that Vesta’s early collisional record (40–200 Myr after CAIs) was erased during its early relaxation phase. The cratering record on Ceres is even less informative as its surface has been continuously viscously relaxed over the age of the solar system and has also experienced widespread resurfacing, which explains the lack of large craters observed across its surface (Hiesinger et al. 2016; Marchi et al. 2016).
This, however, may not be the case for the parent bodies of ordinary chondrites (OCs), namely S-type asteroids. Both thermal evolution models of OC parent bodies (e.g. Monnereau et al. 2013, and references therein) and spectroscopic observations of large S-type families suggest that metamorphosed type 4–6 OCs reflect the internal compositional structure of the largest S-type asteroids (Vernazza et al. 2014). This implies that the interiors of these bodiesnever melted and impacts have been the only evolution process acting since their formation ~2 Myr after the formation of the solar system (e.g. Monnereau et al. 2013). Thus, the shapes of the largest S-type objects (D > 150 km), and to a lesser extent their topography, may help constrain whether the collisional activity was more important during the first 50–200 Myr of the solar system evolution compared to the subsequent ~4.4 Gyr.
As part of our ESO large program (ID 199.C-0074; Vernazza et al. 2018), we observed asteroid (7) Iris (hereafter Iris) with the VLT/SPHERE/ZIMPOL instrument over a full rotation. Iris, which is one of the four D > 200 km S-type mainbelt asteroids along with (3) Juno, (15) Eunomia, and (29) Amphitrite (e.g. Viikinkoski et al. 2015a, 2017; Hanuš et al. 2017a), is an exceptional target for direct-resolved imaging with adaptive optics (AO) due to its large angular size as seen from the Earth (0.33′′) during opposition. Iris is located in the inner part of the asteroid belt, close to Vesta (a = 2.39 au, e = 0.23, i =5.5°), and possesses an LL-like surface composition (Vernazza et al. 2014). Unlike many of the largest asteroids, Iris is not associated with a dynamical family. At first sight, this seems to imply that it did not suffer a major impact during its recent history (most families identified to date are younger than 2 Gyr; see Spoto et al. 2015).
The article is organized as follows. In Sect. 2.1 we describe our observations, the data reduction, and deconvolution. We present the 3D shape model of Iris and its bulk density in Sect. 3.1. We analyze the global shape and surface topography, including a list of the craters, in Sects. 3.2 and 3.3, respectively. Our 3D shape model is then compared to that of Ostro et al. (2010) derived from and independent dataset of radar data. Finally, we summarize the implications of our work in Sect. 4.
2 Observations
2.1 Disk-resolved images
Five series of images of Iris were acquired with the SPHERE instrument (ESO/VLT; Beuzit et al. 2008) during two consecutive nights in October 2017 (see Fig. 1 and Table C.1). The second series from the first night was obtained immediately after the first one, implying that these two epochs sample almost the same geometry (the 7-min gap between the observations corresponds only to a 5° difference in rotation phase). In order not to overweight this geometry in the shape modeling, we lowered the statistical weight of the first series of images. The three remaining series from the second night of observation are of outstanding quality. We clearly resolved several surface features (that we interpret as impact craters) that were consistently present in all images. The spectacular quality of the images is driven by the large angular size of Iris of 0.33′′. Consideringthe distance of Iris at the time of our observations, one pixel represents ~2.3 km at its surface. From our benchmark study of (4) Vesta (Fétick et al. 2019), which orbits approximately at the samedistance from the Earth, we know that we can reliably identify surface features down to ~8–10 pixels in size. The achieved spatial resolution is therefore at least of ~30 mas, corresponding to a projected distance of ~20 km. We also notethat the apparent geometry of Iris during our observations was limited to the southern hemisphere as we observed it almost pole-on (aspect angle ~160°). Therefore, even though the aim of the large program was to obtain six epochs sampling the full rotation phase, additional images would not have brought enough new information to justify acquiring them.
All VLT/SPHERE observations were obtained by the ZIMPOL instrument (Thalmann et al. 2008) in the narrowband imaging configuration (N_R filter; filter central wavelength = 645.9 nm, width = 56.7 nm). The observing strategy is the same for all targets within our ESO large program (see Vernazza et al. 2018, for more details). We used Iris as a natural guide star for AO correction during each series of five cubes of images with a total exposure of 60 s. All images, with the exception of those from the first series, were collected under the required seeing conditions (≤0.8′′) and an airmass below 1.7. We also observed a nearby star aimed to be used as an estimate of the instrumental point spread function (PSF) for deconvolution purposes. However, we later used a parametric PSF for deconvolution of the asteroid data rather than the observed one, owing to better performances (see also Viikinkoski et al. 2018; Fétick et al. 2019). Specifically, we utilized the Mistral deconvolution algorithm (Fusco et al. 2003; Mugnier et al. 2004), and a parametric PSF with a Moffat profile (Moffat 1969). The reliability of using a parametric PSF for deconvolving asteroid images was demonstrated by applying this method to images of (4) Vesta acquired by our program (Fétick et al. 2019): A comparison of these images to in situ data collected by the NASA Dawn mission reveals a very good agreement of the surface features detected on Vesta. The deconvolved images of Iris are shown in Fig. 1.
In addition to our VLT/SPHERE data, we compiled 19 Keck/NIRC2 and 3 VLT/NaCo images of Iris (see Viikinkoski et al. 2017, and Fig. C.1 and Table C.1 for additional information). Although the difference in spatial resolution between NIRC2 (pixel scale 9.9 mas), NaCo (12.25 mas), and our VLT/SPHERE images (pixel scale 3.6 mas) is rather large, a subset of these older data still contains valuable information about the shape of Iris. Moreover, they sample additional geometries (aspect angles of ~70°) compared to the VLT/SPHERE images, obtained close to a southern pole-on configuration (aspect angle of ~160°). Therefore, the NIRC2 and NaCo data essentially provide constraints on the parts of the shape that were not seen by SPHERE, and on the dimension along the rotation axis. Unfortunately, some data were affected by severe deconvolution artifacts, which prevented them from being used for the shape modeling. We list these images for completeness.
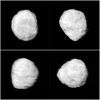 |
Fig. 1 VLT/SPHERE/ZIMPOL images of (7) Iris obtained on October 10 and 11, 2017, and deconvolved with the Mistral algorithm. See Table C.1 for details on the observing conditions. |
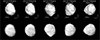 |
Fig. 2 Comparison between the VLT/SPHERE/ZIMPOL deconvolved images of Iris (bottom panel) and the corresponding projections of our ADAM shape model (top panel). The red line indicates the position of the rotation axis. We use a nonrealistic illumination to highlight the local topography of the model. The selected illumination significantly enhances the ridge that spreads from the top to the bottom of the projections on the left-hand side of the figure. This ridge is a minor modeling artifact caused by the limited number of observing geometries sampled by SPHERE. |
2.2 Optical disk-integrated photometry
Optical lightcurves are particularly important for the spin period determination and a proper phasing of the AO images. We downloaded 39 lightcurves from the online Database of Asteroid Models from Inversion Techniques (DAMIT1, Ďurech et al. 2010), which also contains the most recent shape models of the asteroid Iris. In addition, we utilized 94 single lightcurves covering apparitions in 2006, 2008, 2011, and 2012 extracted from the SuperWASP image archive (Grice et al. 2017). The whole optical dataset samples 17 different apparitions between years 1950 and 2013. The characteristics of the photometric data are listed in Table C.2.
3 Results
3.1 3D shape reconstruction, size, and bulk density
We used theAll-Data Asteroid Modeling (ADAM) inversion technique (Viikinkoski et al. 2015a; Viikinkoski 2016) for the reconstruction of the 3D shape model and the spin of Iris using disk-integrated (optical lightcurves) and disk-resolved data as inputs. The ADAM technique is a well-described inversion algorithm that has already been applied to tens of asteroids (e.g. Viikinkoski et al. 2015b, 2017, 2018; Hanuš et al. 2017a,b; Marsset et al. 2017; Vernazza et al. 2018). Exhaustive information about this modeling technique can be found in these studies.
Optical lightcurves are often required for ADAM, because they stabilize the shape optimization and constrain the parts of the shape not covered by the AO observations. Disk-resolved data provide necessary constraints on the local topography. Without these data, the use of ADAM would be redundant: standard lightcurve inversion codes would be sufficient. We note that the priori knowledge of the sidereal rotation period and the spin axis orientation of the asteroid is used as an initial input for ADAM. In the case of Iris, both quantities were already constrained by previous studies (Kaasalainen et al. 2002; Ostro et al. 2010; Viikinkoski et al. 2017).
We applied the ADAM algorithm to our dataset of 133 optical lightcurves, 25 VLT/SPHERE/ZIMPOL images from five different epochs, 19 Keck/NIRC2 images, and three VLT/NaCo images. We first computed a rough global representation of the shape model of Iris by enhancing the weight of the lightcurve data with respect to that of the AO images. We ensured that the shape model solution was stable by testing different combinations of (i) shape support (i.e. octantoids and subdivision) (ii) AO data types (deconvolved or nondeconvolved images), and (iii) shape model resolutions. Moreover, we lowered the weight of the first-epoch AO SPHERE images, as well as that of several Keck images of poor quality. The low-resolution model was then used as a starting point for the modeling with more topographic details. The resulting model contains the most prominent surface features visible in the SPHERE images (Fig. 2).
Table 1 provides the final values for the spin-axis orientation, sidereal rotation period, volume-equivalent diameter, and dimensions along the major axes of Iris. These parameters were computed as their average values from the various shape models, and the reported uncertainties correspond to their range of values within these models. Only one shape model was selected as the representative solution that will be included in the DAMIT database. This solution, which is based on the deconvolved AO data and the octantoid shape support (Viikinkoski et al. 2015a), has parameter values that are slightly different from the average ones reported in Table 1, while within the quoted uncertainties. A comparison between the SPHERE AO images and the corresponding projections of the model is shown in Fig. 2. A comparison between the Keck/NIRC2 and VLT/NaCo images and the model is provided in Fig. C.1.
The shape model contains only the most obvious craters, for which we measured the size and depth (Table 2). In general, the crater sizes derived from the model are overestimated (except for Xanthos; see Sect. 3.3), whereas their depth is underestimated compared to the estimates retrieved directly from the images (Sect. 3.3). This is an outcome of the modeling technique.
We combined the volume of Iris derived from our shape model (Table 1) with its mass estimate derived from all reliable estimates found in the literature (see Table C.3; Carry 2012). Specifically, we used the median of the 30 reported mass estimates, after removing the five least reliable values. The resulting mass values are similar to the median of the whole sample. Considering the high number of reliable mass estimates available and their disparity, we consider our mass estimate for Iris to be rather robust: (13.75 ± 1.30) × 1018 kg (1σ error). This leads to a bulk density of ρ = 2.7 ± 0.3 g cm−3 (1σ error), with an uncertainty that is dominated by the uncertainty on the mass.
In order to compare the bulk density of Iris with that of other S-type asteroids, we compiled a database of reliable bulk density measurements for 21 S-type asteroids listed in Table C.4, and shown in Fig. C.2. Iris’s bulk density appears slightly lower than that of most of the other large (D > 150 km) S-type asteroids, but it is still consistent within the reported error bars. Finally, the density appears consistent with that of its meteoritic analog, namely LL ordinary chondrites (the mean bulk density of LL chondrites is 3.22± 0.22 g cm−3; Consolmagno et al. 2008).
Volume-equivalent diameter (D), dimensions along the major axis (a, b, c), sidereal rotation period (P), spin-axis ecliptic J2000 coordinates (longitude λ and latitude β), mass (m), and bulk density (ρ) of Iris as determined here, compared with values from the works of Ostro et al. (2010) and Viikinkoski et al. (2017).
3.2 Global shape
The overall shape of Iris is probably one of the most intriguing properties of this body revealed by our observations. Both the SPHERE images and the global appearance of our 3D shape model indicate an oblate spheroidal shape, with a seemingly large excavation close to its equator (Fig. 3). Based on our 3D shape model, we estimate that this excavation represents between 10 and 15% of the volume of Iris.
The nearly spheroidal shape of Iris opens the possibility that this asteroid formed as an almost perfect oblate spheroid. If this is the case, its equatorial depression may be the result of a large-scale impact. Yet, this seems surprising considering the absence of a collisional family associated with Iris (Appendix A). Families associated with large asteroids are a common feature in the main belt, and some of these families are known to exist over several Gyr before they dissipate via Yarkovsky drifting and collisional grinding (Vokrouhlický et al. 2006, 2015). For instance, the NASA Dawn mission revealed ages of 1 and 2 Gyr for the two large craters that form the Rheasilvia basin on Vesta (Schenk et al. 2012; Marchi et al. 2012b), implying similar ages for the two collisional families associated with Vesta (Milani et al. 2014). Additional old families in the asteroid belt include those of Hygiea (2 Gyr), Eunomia (2.5 Gyr), Koronis (2.5 Gyr), and Themis (3 Gyr) (Brož et al. 2013; Nesvorný et al. 2015; Spoto et al. 2015). Assuming that a large impact is at the origin of the depression, the lack of an Iris family seems to imply that the collision occurred during the very early phase of solar system evolution (>3 Gyr ago). This is strengthened by the fact that Iris is located in a dynamically stable region of the asteroid belt, nearby Vesta, and far away from any strong orbital resonances with the giant planets. This location implies that its family must have depleted very slowly. Numerical integrations for the collisional evolution of the asteroid belt reveal that events able to excavate at least 10% of the mass of Iris happen 0 to 2 times over a timescale of 4 Gyr (see Fig. B.1 and Appendix B).
An alternative explanation for the lack of an Iris family could be that Iris experienced, even recently, a near-miss “hit-and-run” collision where it was impacted close to the edge. In this case, the fragments would have gained most of the projectile momentum and would have scattered away from the space of the Iris proper orbital elements.
Finally, we cannot entirely rule out that Iris may have never had a spheroidal shape, and that its current shape is close to the original one. Our program will help determine whether similar shapes are found for other D ~ 200 km asteroids. In turn, this will provide new constraints on the origin of asteroid shapes, and the possible link existing between asteroid shapes and the presence of collisional families.
Identified and suggested topographic features on Iris.
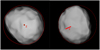 |
Fig. 3 Visualization of the shape model of Iris from a southern pole-on view (left), and from the geometry of the second epoch of observation (rotation phase 0.03, right). We embedded the shape projection within a circle to highlight the excavated part and included the z-axis orientation. |
3.3 Impact craters
We identified eight topographic features on the images, with typical diameters between 20 and 50 km, that we consider as putative impact craters based on their apparent circular morphology (Table 2, Fig. 4). We nicknamed them with the Greek names of colors to reflect their association with Iris, the goddess of the rainbow in Greek mythology. The pole-on geometry of Iris during our observations allowed us to accurately trace the position of the craters throughout a complete rotation period. All the reported craters were identified from the images, simultaneously using the shape model to track their location at every epoch in order to verify their reliability and visibility.
Six out of the eight identified putative craters are clearly visible in at least three epochs shown in Fig. 4. The remaining two craters were identified at a single epoch that corresponds to the Iris 0.03-rotation phase angle. Of these two craters, the one we call Chrysos is also visible at the 0.72-rotation phase angle. These two craters remained undetected in the other images, likely due to unfavorable illumination conditions (see also Fétick et al. 2019). We indicate their expected location on each image based on the rotation period of Iris, and using their position on the single image where they were detected as a benchmark. Several additional surface features considered as potential candidates for impact craters are highlighted in Fig. 4 by the letters A–G.
Table 2 summarizes the coordinates, estimated size, and proposed names or designations for the identified topographic features. The reference zero longitude of the asteroid-centric coordinate system was defined as the location of the large equatorial depression Xanthos, following the IAU recommendation for the reference frame (Archinal et al. 2018). For each epoch we also indicate whether the feature falls within the visible part of the asteroid and whether it could be identified on the series of images that corresponds to that epoch. Crater diameters were directly measured on the images by first removing the illumination gradient from the asteroid images (see Carry et al. 2008, 2010a, for details), and then by drawing a projection of the image’s brightness level (number of counts) along the craters and for different orientations. The edges of the craters were defined as the locations where the profiles start to reach a plateau outward from the center of the crater. We used the 3D shape model to measure the planetocentric latitude and longitude of the craters. For the five craters that are visible on the shape model, we computed their diameter and depth following the method described in Vernazza et al. (2018). The values derived for Xanthos and Chrysos are consistent with the measurements from the images, while those for Chloros, Cirrhos, and Glaucos are overestimated by about 50%. Moreover, we measured the depth of three craters conveniently located near the asteroid’s terminator on the images acquired at 0.72-rotation phase angle. This configuration allows us to measure the orthogonal distance from the bottom of the crater to the tangent of the surface between the rims. Specifically, we find a value of ~15 km for Xanthos, with an uncertainty of 3 km that reflects the pixel scale of the images. A similar depth for Xanthos was also derived from the shape model. This value seems to be robust because the Xanthos appearance on the shape model is largely consistent with the images.
In the case of Xanthos, the measured depth-to-diameter (d∕D) ratio is ~0.34. This value is higher than that for similarly sized craters on Vesta (d∕D = 0.15–0.27; Vincent et al. 2014). Given that Iris and Vesta are rocky bodies made of similar tensile-strength materials (LL ordinary chondrites and HED achondrites, respectively), the observed difference in crater morphology may be due to Vesta’s larger surface gravity g (around 3 times higher than that of Iris), which would more efficiently reshape its craters, for example through landslides and erosion. Vesta’s larger g also makes it more likely to refill its craters with a reaccreted, impact-generated surface regolith, whereas a larger fraction of impact ejecta would be lost after an impact on a smaller, Iris-sized body. Along these lines, Thomas (1999) found that the crater morphology on asteroids and the satellites of the giant planets scales as the inverse of surface gravity, therefore, 30 km craters on Iris should have (and actually have) similar morphology as 10 km craters on Vesta.
Apart from Vesta, the only rocky asteroid imaged by a spacecraft where a crater 20–60 km in diameter can be found is (21) Lutetia, a ~100 km large main belt asteroid. Massilia, the largest crater on Lutetia, has a diameter of 55 km and a depth of about 2 km (Cremonese et al. 2012), which implies d∕D = 0.04. This value is significantly lower than the one we derived for Xanthos. Considering the morphology scaling with the inverse of surface gravity, Massilia should be compared to 20–30 km craters on Iris. Clearly, Massilia is rather shallow compared to the craters on Iris, which could be explained by physical resurfacing processes such as regolith deposits and relaxation. The fact that Massilia’s diameter is comparable to the size of Lutetia also certainly impacts its morphology.
We also did not see any evidence of complex craters on Iris. In particular, none of the identified putative craters exhibits the presence of a central peak. At first glance, craters with central peaks may be visible on the images acquired at 0.03-rotation phase angle. However, these features all remain undetected on the other images, which are all of slightly higher quality (acquired atlower airmass). We therefore attribute them to instrumental or deconvolution artifacts. Following the scaling law proposed by Asphaug et al. (1996), the transition diameter from simple to complex craters for Iris is D = 0.8Y∕(g ρ) = 74 km, where Y = 2 × 10⁷ N m−2 is the average tensile strength of silicates, g = 0.08 m s−2 is the average gravitational acceleration on Iris, and ρ = 2.7 g cm−3 is its density. The lack of complex craters and central peaks is therefore not surprising considering the range of crater sizes detected on Iris.
Finally, the observed crater density on Iris is similar to that predicted by numerical simulations (see Fig. B.1 and Appendix B) and consistent with the surface age >3 Gyr (i.e. there was not a recent collision that erased the cratering record on Iris). This highlights that models simulating the collisional evolution of the asteroid belt have become robust.
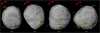 |
Fig. 4 Identified and proposed surface features on Iris. Putative impact craters are indicated by names and often with a contour showing the estimated area they cover. Candidates for impact craters are indicated by white-font letters and contours, in italic if the contours were not clearly defined. A question mark indicates the expected position of a feature that could not be identified on the image, likely due to unfavorable illumination. |
3.4 Comparison with (4) Vesta and (21) Lutetia
In order to compare the cratering record on the surface of Iris with records on (4) Vesta and (21) Lutetia, we computed the corresponding crater density n on Iris. For the six craters with Dc > 30 km observed on Iris and the surface area corresponding to a 220 km sphere, i.e. slightly larger than for an equivalent volume, we obtained n =3.9 × 10⁻⁵ km−2. This value is clearly a lower limit because (i) only about a half of the surface was observed by SPHERE, (ii) there might still be some observational bias, and (iii) the cratering record could be affected by resurfacing. This would increase n by corresponding factors: fvisible, fbias, and fresurf. Naturally, the age of the surface is counted from the last catastrophic or reaccumulation event.
For comparison, (4) Vesta and its Rheasylvia (RS) basin floor has a crater density nRS = 1.7 × 10⁻⁵ km−2 and an estimated age of tRS ≐1 Gyr (Marchi et al. 2012b, 2015). If we assume the factors fvisible = 2, fbias = 1, and fresurf = 1 for simplicity, the age of the surface of Iris would theoretically be t≐fvisiblefbiasfresurf (n∕nRS) tRS ≳ 4.0 Gyr. More precisely, we should use the π-scaling factor of Melosh (1989) for the projectile-to-crater (Dc -to-dp) size scaling (see Appendix B and Eq. (B.1)): for the same projectile population with dp ≥ 2 km, we should have crater diameters Dc ≥ 19.3 km on Vesta (we neglect the minor differences in collisional probabilities, and gravitational focusing factors). Finally, we also considered the heavily cratered terrains (HCT) on Vesta, for which the crater density is nHCT ≐9.5 × 10⁻⁵ km−2. Assuming this unit is as old as 4.0 Gyr, it would lead to t = 3.3 Gyr for the age of the surface of Iris.
On the other hand, (21) Lutetia and its Achaia region has a crater density of nAch ≐2 × 10⁻⁴ km−2. This value is substantially higher than for Iris and Vesta; however, it is extrapolated from Dc = 20 km with an uncertainty of at least a factor of 2 (there are actually no 30 km craters on Achaia). The corresponding surface age is up to 3.8 Gyr, i.e. presumably formed during the late heavy bombardment (Marchi et al. 2012a). The π-scaling factor is very similar to that for Iris. However, a statistics of small numbers plays an important role in this case. Consequently, the inferred age is very uncertain, it may be lower than 1 Gyr, or reach up to 3 Gyr (1σ).
3.5 Comparison with the radar model of Ostro et al. (2010)
An exceptional dataset of Iris delay-Doppler images (the best dataset for a main belt asteroid) was acquired in November 2006 by the Arecibo observatory when Iris was at a distance of only 0.85 AU from the Earth (Ostro et al. 2010). By coincidence, our SPHERE observations were obtained at an observing geometry very similar to that of the radar data, so both datasets map only the southern hemisphere of Iris. This is very convenient for the comparison of the performance of the two independent modeling approaches. A radar-based shape model of Iris was reconstructed by Ostro et al. (2010) and kindly provided in the form of a polyhedron by Chris Magri. Unfortunately, the uncertainty in the rotation period from Ostro et al. (2010) was too large to compute the correct rotation phase of the Iris radar model at the time of the SPHERE observations in 2017. Therefore, we found the optimal rotation offset by visually comparing the radar projections for different values of the rotation phase to the projections of the ADAM model and the SPHERE images. We identified several common surface features on both models and images, so the estimated rotation phase of the radar shape model seems to be reliable at the level of ~5°.
There are substantial discrepancies between the radar and the AO images as shown in Fig. C.3. Specifically, the contoursof the radar shape model projections do not agree well with those of the images or ADAM model, which is most apparent in epochs 3–5 (rotation phases 0.47, 0.59, and 0.72). Considering that deconvolution of disk-resolved images obtained with AO-fed cameras have been validated by several spacecraft encounters (e.g. Witasse et al. 2006; Carry et al. 2008, 2010b, 2012; Russell et al. 2016), we conclude that the appearance of the radar shape model is not accurate. On the other hand, several surface features (craters Xanthos, Chloros, Cyanos, and Erythras) identified in the SPHERE images are present in the radar-based model. The concavity related to the Xanthos crater is very prominent in the radar model and is significantly enhanced compared to the AO images or the ADAM model. In general, the topography of the radar-based model is more dramatic and exaggerated compared to the SPHERE images, and it contains some spurious features (e.g. sharp mountains) not detected in our images. However, the fact that the main surface features seen in the SPHERE images are also described by the radar-based model illustrates a partial robustness of the modeling technique.
Finally, the radar model contains a large concavity in the C region that we identified only in one AO epoch (rotation phase 0.47). This further supports the existence of this proposed candidate for an impact feature. The radar model indicates a single impact basin, while the image and the ADAM shape model tends to be more consistent with two partially overlapping craters.
4 Summary
We obtained VLT/SPHERE/ZIMPOL images of (7) Iris revealing surface details for this object with unprecedented precision. Our set of images was used to constrain and characterize Iris’s 3D shape (hence volume and density when combining the latter with current mass estimates), identify several impact craters, measure their sizes, and (for some) their depth. The nearly pole-on orientation of Iris during our observations allowed us to track impact surface features throughout its rotation and to easily discriminate real features from instrumental and deconvolution artifacts, while highlighting the level of reliability of features identification with SPHERE.
The derived bulk density for Iris (2.7 ± 0.3 g cm−3) appears consistent with its LL ordinary chondrite surface composition. The shape of Iris is reminiscent of an almost perfect oblate spheroid with a large equatorial excavation. This may suggest that Iris formed with a spheroidal shape and subsequently suffered a large impact. In that case, the lack of an asteroid family associated with Iris would imply that this impact occurred a long time ago (>3 Gyr). Alternatively, this excavation may be the result of a more recent near-miss hit-and-run collision, in which the fragments were scattered far away from the space of the proper orbital elements of Iris. However, the surface age of ~3–4 Gyr inferred from the crater density makes the recent collision unlikely. It should be noted that we cannot entirely rule out the possibility that this apparent excavation reflects the original shape of Iris. Additional AO observations of large asteroids with and without families will help tackle this question.
Our shape model appears to be only partially consistent with the radar-based shape model of Ostro et al. (2010): Both models contain similar surface features that we associated with the largest impact craters on Iris covering its southern hemisphere and equatorial region. However, the contours of the radar shape model projections do not agree well with those of the images and the ADAM model. The partial agreement between the two shape-reconstruction methods based on two independent datasets supports the reliability of the surface features interpreted here as putative impact basins, and suggests that the radar-based shape model tendsto overestimate the surface topography and to reproduce less accurately the global appearance of Iris.
Finally, we attribute the difference in the morphology (d∕D) of similarly sized craters (d ~30–50 km) between Iris and Vesta (both rocky bodies are made of similar tensile-strength materials) to their different surface gravity, and the absence of asubstantial impact-induced regolith on Iris.
Acknowledgements
We thank Simone Marchi for his pertinent and constructive remarks. This work has been supported by the Czech Science Foundation through grants 18-09470S (J. Hanuš, J. Ďurech) and 18-04514J (M. Brož) and by the Charles University Research program No. UNCE/SCI/023. P. Vernazza, A. Drouard, J. Grice, and B. Carry were supported by CNRS/ INSU/PNP. We thank Chris Magri for kindly providing the radar shape model published in Ostro et al. (2010).
Appendix A Lack of an Iris family
We demonstrate here the absence of an apparent collisional family linked to Iris. Iris is located in the inner main belt at ap = 2.386 AU, ep = 0.213, and sin Ip = 0.111. From the latest (September 2018) catalog of proper elements from Knežević & Milani (2003), we consider the subset of asteroids with albedo similar to that of Iris, pV = 0.252 (to within ± 0.1), and confirm that there is no clustering of asteroids in the orbital parameter space of Iris (Fig. A.1). In the vicinity of Iris, thereis only one identified family located at lower inclinations and related to the C-type asteroid (163) Erigone. From a dynamical point of view, there are no strong resonances near Iris except for the three-body resonance 4:2:1 with Jupiter and Saturn at 2.4 AU. The Jupiter 3:1 mean-motion resonance is farther away from Iris.
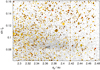 |
Fig. A.1 Vicinity of (7) Iris in the ap vs. sin Ip space of proper orbital elements. The eccentricity range is ep ∈ (0.162;0.262). Asteroids with albedo within ± 0.1 of the Iris value (pV = 0.252), are plotted in yellow, with symbol size proportional to the body diameter. Asteroids with unknown albedo are plotted as gray dots. The family visible at sin Ip ≐ 0.09 is related to the dark C-type asteroid (163) Erigone. The dashed ellipse corresponds to the escape velocity from Iris, vesc ≐ 130 m s−1, converted to orbital elements using the Gauss equations. This velocity was computed for true anomaly f = 180° and argument of perihelion ω = 0°. |
Appendix B Collisional evolution of Iris
The collisional evolution of Iris was modeled using the Boulder code for Monte Carlo collisional simulations (Morbidelli et al. 2009; Cibulková et al. 2014), in a similar way to that described in Vernazza et al. (2018) for asteroid (89) Julia. We describe here only the main steps of the procedure, while additional details can be found in the above-mentioned study.
We considered two populations of objects: the main asteroid belt, and Iris and its collisional fragments. We assumed a constant intrinsic collisional probability of Pi = 3.10 × 10⁻¹⁸ km−2 yr−1, and impact velocities of vimp = 5.28 km s−1 (Dahlgren 1998). A size-dependent dynamical decay was included, with rates taken from Bottke et al. (2005). We used the standard scaling law of Benz & Asphaug (1999) for the kinetic energy threshold  of basalt at impact velocities of 5 km s−1. The density of Iris and its fragments was set to ρ = 2.7 g cm−3. The nominal time span of the simulations was set to 4 Gyr. Multiple simulations with different random seeds were performed, allowing fractional probabilities for breakups of the individual large asteroids. Initial conditions were chosen to match the observed size-frequency distribution of the asteroid belt.
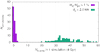 |
Fig. B.1 Number of simulations in which particular events were detected: (i) the ejected mass Mej over the parent-body mass Mpb was > 1%; (ii) the projectile diameter was dp > 2.0 km. The former is related to the shape of (7) Iris, the latter to the number of impact craters >30 km on Iris. |
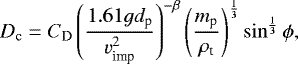
Running a hundred simulations, we found that the evolved size-frequency distribution of the asteroid belt closely matches the observed distribution, except for the short-end tail (D < 1 km), which is affected by observation incompleteness. The evolved Iris population contains some fragments, with the largest fragment typically ranging between 5 and 10 km in size. This is not enough to expect an observable family at any time because small asteroids quickly disperse via the Yarkovsky effect on timescales of a few 100 Myr. Moreover, we found that about 10% of the simulations barely produced any observable fragments, with the largest fragment having D < 2 km. Next, we performed an extraction of impact events relevant to the craters seen on Iris. We used the π-scaling factor of Melosh (1989) for the projectile-to-crater (Dc -to-dp) size scaling,
 (B.1)
(B.1)
where CD = 1.6 and β = 0.22 are the material parameters for competent rock or saturated soil (Schmidt & Housen 1987), g is the gravitational acceleration of the target, mp is the projectile mass, ρp = 3000 kg m−3 its density, ρt the target density, and ϕ = 45° the assumed mean impact angle. Using this scaling law, the measured sizes of the craters seen on Iris (Dc = 20−40 km) imply projectile sizes of dp = 1.2–2.9 km.
The number of impact events with dp > 2.0 km is shown in Fig. B.1. We selected this size of impactor because it corresponds to a crater size of ~30 km. Such craters and larger ones were easily identified in the images, contrary to the smaller ones, which are on the detection limit and their true number should be significantly higher than suggested by our analysis. The median number of events is ~35, with 10 and 90% of 25 to 48, which is larger than the observed number of craters of ~10 (including the candidates). However, our detected craters lie only on the southern hemisphere; therefore, their expected number should be larger by a factor of 2. Moreover, we likely did not identify all the craters on the surface, due to unfavorable illumination(see Fétick et al. 2019, where we discuss this in more detail). Finally, our simulations neglect all kinds of resurfacing and crater degradation by the ejecta, which should further decrease the number of detected craters. As a result, the number of detected craters is consistent with the numerical model, which makes the surface age of >3 Gyr plausible.
We then focused on impacts that are neither cratering events nor catastrophic disruptions. Such impacts can significantly alter the global shape of the original Iris parent body, and explain the observed depression on Iris (Sect. 3.2). Our simulations reveal that events able to produce an ejected mass over the parent body mass ratio of Mej ∕Mpb > 1%, which corresponds to the observed excavated volume of the depression on Iris (i.e. ~10% of the Iris’ volume), happen usually once or twice in 4 Gyr in about half of the simulations (Fig. B.1). Here we assume thatthe ejected mass of about 10% of the excavated mass for Iris is greater than for Julia (2%, Vernazza et al. 2018), however, still reasonable because the proposed impact on Iris is larger than on Julia. Clearly, the ejected mass compared to the excavated mass increases with the impactor size (it is zero for small impactors and equals the excavated mass for catastrophicdisruptions). Therefore, we cannot exclude the possibility that Iris has suffered such a large collision in the past.
While this appears incompatible with the lack of a collisional family associated with Iris, we note that a nearly missed collision, where the target is hit close to its edge, has a similar probability of happening as a direct hit: for a projectile that delivers at least half of its kinetic energy, the effective cross section is  . For a projectile that almost misses the target, it is
  . These areas become equal for
  . In such a collision, the fragments would gain enough momentum to be scattered far away from the impacted body.
Considering that we observe a nonnegligible number of large asteroids (D > 100 km) associated with families (Nesvorný et al. 2015), we expect that some nearly missed objects must also exist in the main belt. Placing Iris in the context of a substantial sample of similarly sized asteroids will help determine whether the near-miss collision constitutes a viable process to explain the shape of these objects, and the absence of families associated with them. This will be possible in the near future when the sample of asteroids with AO-resolved topography reaches several tens of objects.
Appendix C Additional figures and tables
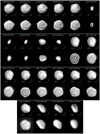 |
Fig. C.1 Comparison between the Keck/NIRC2 and VLT/NaCo deconvolved images of Iris (rows 2 and 4), and the corresponding projections of our shape model (rows 1 and 3). The red line indicates the position of the rotation axis. Data affected by deconvolution artifacts were not used for the shape modeling. |
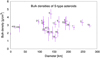 |
Fig. C.2 Reliable bulk density measurements for 21 S-type asteroids compiled from the literature. |
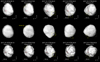 |
Fig. C.3 Comparison between the VLT/SPHERE/ZIMPOL deconvolved images of Iris (middle panel) and the corresponding projections of our shape model (top panel), and the shape model of Ostro et al. (2010) based on delay-Doppler data collected with Arecibo (bottom panel). The red line indicates the position of the rotation axis. We used a nonrealistic illumination to highlight the local topography of the models. We highlight the main topographic features. |
Disk-resolved images.
Optical disk-integrated lightcurves used for ADAM shape modeling.
Mass estimates ( ) of (7) Iris from the literature.
Size and bulk density estimates of large S-type asteroids compiled from the literature.
References
- Archinal, B. A., A’Hearn, M. F., Bowell, E., et al. 2011, Celest. Mech. Dyn. Astron., 109, 101 [Google Scholar]
- Archinal, B. A., Acton, C. H., A’Hearn, M. F., et al. 2018, Celest. Mech. Dyn. Astron., 130, 22 [Google Scholar]
- Aslan, Z., Gumerov, R., Hudkova, L., et al. 2007, in Solar and Stellar Physics Through Eclipses, eds. O. Demircan, S. O. Selam, & B. Albayrak, ASP Conf. Ser., 370, 52 [NASA ADS] [Google Scholar]
- Asphaug, E., Moore, J. M., Morrison, D., et al. 1996, Icarus, 120, 158 [NASA ADS] [CrossRef] [Google Scholar]
- Baer, J., & Chesley, S. R. 2017, AJ, 154, 76 [NASA ADS] [CrossRef] [Google Scholar]
- Baer, J., Milani, A., Chesley, S. R., & Matson, R. D. 2008, BAAS, 40, 493 [NASA ADS] [Google Scholar]
- Baer, J., Chesley, S. R., & Matson, R. D. 2011, AJ, 141, 143 [NASA ADS] [CrossRef] [Google Scholar]
- Belton, M. J. S., Chapman, C. R., Thomas, P. C., et al. 1995, Nature, 374, 785 [NASA ADS] [CrossRef] [Google Scholar]
- Benz, W., & Asphaug, E. 1999, Icarus, 142, 5 [NASA ADS] [CrossRef] [Google Scholar]
- Beuzit, J.-L., Feldt, M., Dohlen, K., et al. 2008, in Ground-based and Airborne Instrumentation for Astronomy II, Proc. SPIE, 7014, 701418 [Google Scholar]
- Bottke, W. F., Durda, D. D., Nesvorný, D., et al. 2005, Icarus, 179, 63 [NASA ADS] [CrossRef] [Google Scholar]
- Brož, M., Morbidelli, A., Bottke, W. F., et al. 2013, A&A, 551, A117 [NASA ADS] [CrossRef] [EDP Sciences] [Google Scholar]
- Carry, B. 2012, Planet. Space Sci., 73, 98 [NASA ADS] [CrossRef] [Google Scholar]
- Carry, B., Dumas, C., Fulchignoni, M., et al. 2008, A&A, 478, 235 [NASA ADS] [CrossRef] [EDP Sciences] [Google Scholar]
- Carry, B., Dumas, C., Kaasalainen, M., et al. 2010a, Icarus, 205, 460 [NASA ADS] [CrossRef] [Google Scholar]
- Carry, B., Kaasalainen, M., Leyrat, C., et al. 2010b, A&A, 523, A94 [NASA ADS] [CrossRef] [EDP Sciences] [Google Scholar]
- Carry, B., Kaasalainen, M., Merline, W. J., et al. 2012, Planet. Space Sci., 66, 200 [Google Scholar]
- Chang, Y. C., & Chang., C. S. 1963, Acta Astron. Sin., 11, 139 [Google Scholar]
- Chernetenko, Y. A., & Kochetova, O. M. 2002, in Asteroids, Comets and Meteors, ed. B. Warmbein, (The Netherlands: ESA SP), ACM, 500, 437 [Google Scholar]
- Cibulková, H., Brož, M., & Benavidez, P. G. 2014, Icarus, 241, 358 [NASA ADS] [CrossRef] [Google Scholar]
- Consolmagno, G., Britt, D., & Macke, R. 2008, Chemie der Erde / Geochemistry, 68, 1 [Google Scholar]
- Cremonese, G., Martellato, E., Marzari, F., et al. 2012, Planet. Space Sci., 66, 147 [NASA ADS] [CrossRef] [Google Scholar]
- Dahlgren, M. 1998, A&A, 336, 1056 [NASA ADS] [Google Scholar]
- Ďurech, J., Sidorin, V., & Kaasalainen, M. 2010, A&A, 513, A46 [NASA ADS] [CrossRef] [EDP Sciences] [Google Scholar]
- Fétick, R. J., Jorda, L., Vernazza, P., et al. 2019, A&A, 623, A6 [NASA ADS] [CrossRef] [EDP Sciences] [Google Scholar]
- Fienga, A., Manche, H., Laskar, J., & Gastineau, M. 2008, A&A, 477, 315 [NASA ADS] [CrossRef] [EDP Sciences] [Google Scholar]
- Fienga, A., Kuchynka, P., Laskar, J., Manche, H., & Gastineau, M. 2011, EPSC-DPS Joint Meeting 2011, 1879 [NASA ADS] [Google Scholar]
- Fienga, A., Manche, H., Laskar, J., Gastineau, M., & Verma, A. 2013, ArXiv e-prints [arXiv:1301.1510] [Google Scholar]
- Fienga, A., Manche, H., Laskar, J., Gastineau, M., & Verma, A. 2014, ArXiv e-prints [arXiv:1405.0484] [Google Scholar]
- Foglia, S. 1992, Minor Planet Bull., 19, 19 [NASA ADS] [Google Scholar]
- Folkner, W. M., Williams, J. G., & Boggs, D. H. 2009, IPN Progress Report, 42, 1 [Google Scholar]
- Fu, R. R., Hager, B. H., Ermakov, A. I., & Zuber, M. T. 2014, Icarus, 240, 133 [NASA ADS] [CrossRef] [Google Scholar]
- Fujiwara, A., Kawaguchi, J., Yeomans, D. K., et al. 2006, Science, 312, 1330 [NASA ADS] [CrossRef] [PubMed] [Google Scholar]
- Fusco, T., Mugnier, L. M., Conan, J.-M., et al. 2003, in Adaptive Optical System Technologies II, eds. P. L. Wizinowich & D. Bonaccini, Proc. SPIE, 4839, 1065 [NASA ADS] [CrossRef] [Google Scholar]
- Gehrels, T., & Owings, D. 1962, ApJ, 135, 906 [NASA ADS] [CrossRef] [Google Scholar]
- Goffin, E. 2014, A&A, 565, A56 [NASA ADS] [CrossRef] [EDP Sciences] [Google Scholar]
- Grice, J., Snodgrass, C., Green, S. F., Parley, N. R., & Carry, B. 2017, in Asteroids, Comets, and Meteors: ACM [Google Scholar]
- Groeneveld, I., & Kuiper, G. P. 1954, ApJ, 120, 200 [NASA ADS] [CrossRef] [Google Scholar]
- Hanuš, J., Viikinkoski, M., Marchis, F., et al. 2017a, A&A, 601, A114 [NASA ADS] [CrossRef] [EDP Sciences] [Google Scholar]
- Hanuš, J., Marchis, F., Viikinkoski, M., Yang, B., & Kaasalainen, M. 2017b, A&A, 599, A36 [NASA ADS] [CrossRef] [EDP Sciences] [Google Scholar]
- Hiesinger, H., Marchi, S., Schmedemann, N., et al. 2016, Science, 353, aaf4758 [NASA ADS] [CrossRef] [Google Scholar]
- Hoffmann, M.,& Geyer, E. H. 1993, A&AS, 101, 621 [NASA ADS] [Google Scholar]
- Ivantsov, A. 2008, Planet. Space Sci., 56, 1857 [NASA ADS] [CrossRef] [Google Scholar]
- Kaasalainen, M., Torppa, J., & Piironen, J. 2002, Icarus, 159, 369 [NASA ADS] [CrossRef] [Google Scholar]
- Knežević, Z., & Milani, A. 2003, A&A, 403, 1165 [NASA ADS] [CrossRef] [EDP Sciences] [Google Scholar]
- Kochetova, O. M. 2004, Sol. Syst. Res., 38, 66 [NASA ADS] [CrossRef] [Google Scholar]
- Kochetova, O. M., & Chernetenko, Y. A. 2014, Sol. Syst. Res., 48, 295 [NASA ADS] [CrossRef] [Google Scholar]
- Konopliv, A. S., Asmar, S. W., Folkner, W. M., et al. 2011, Icarus, 211, 401 [NASA ADS] [CrossRef] [Google Scholar]
- Krasinsky, G. A., Pitjeva, E. V., Vasiliev, M. V., & Yagudina, E. I. 2001, Communications of IAA of RAS [Google Scholar]
- Kuchynka, P., & Folkner, W. M. 2013, Icarus, 222, 243 [NASA ADS] [CrossRef] [Google Scholar]
- Lagerkvist, C.-I., & Williams, I. P. 1987, A&AS, 68, 295 [NASA ADS] [Google Scholar]
- Marchi, S., Massironi, M., Vincent, J.-B., et al. 2012a, Planet. Space Sci., 66, 87 [NASA ADS] [CrossRef] [Google Scholar]
- Marchi, S., McSween, H. Y., O’Brien, D. P., et al. 2012b, Science, 336, 690 [NASA ADS] [CrossRef] [Google Scholar]
- Marchi, S., Chapman, C. R., Barnouin, O. S., Richardson, J. E., & Vincent, J.-B. 2015, Cratering on Asteroids, eds. P. Michel, F. E. DeMeo, & W. F. Bottke (Tucson: University of Arizona Press), 725 [Google Scholar]
- Marchi, S., Ermakov, A. I., Raymond, C. A., et al. 2016, Nat. Commun., 7, 12257 [NASA ADS] [CrossRef] [Google Scholar]
- Marsset, M., Carry, B., Dumas, C., et al. 2017, A&A, 604, A64 [NASA ADS] [CrossRef] [EDP Sciences] [Google Scholar]
- Melosh, H. J. 1989, Impact cratering: A geologic process (Oxford: Oxford University Press) [Google Scholar]
- Milani, A., Cellino, A., Knežević, Z., et al. 2014, Icarus, 239, 46 [NASA ADS] [CrossRef] [Google Scholar]
- Moffat, A. 1969, A&A, 3, 455 [NASA ADS] [Google Scholar]
- Monnereau, M., Toplis, M. J., Baratoux, D., & Guignard, J. 2013, Geochim. Cosmochim. Acta, 119, 302 [NASA ADS] [CrossRef] [Google Scholar]
- Morbidelli, A., Bottke, W. F., Nesvorný, D., & Levison, H. F. 2009, Icarus, 204, 558 [NASA ADS] [CrossRef] [Google Scholar]
- Mugnier, L. M., Fusco, T., & Conan, J.-M. 2004, JOSA A, 21, 1841 [Google Scholar]
- Nesvorný, D., Brož, M., & Carruba, V. 2015, Identification and Dynamical Properties of Asteroid Families, eds. P. Michel, F. E. DeMeo, & W. F. Bottke, (Tucson: University of Arizona Press), 297 [Google Scholar]
- Ostro, S. J., Magri, C., Benner, L. A. M., et al. 2010, Icarus, 207, 285 [NASA ADS] [CrossRef] [Google Scholar]
- Pitjeva, E. V. 2004, in COSPAR, Plenary Meeting, ed. J.-P. Paillé, 35, 35th COSPAR Scientific Assembly, 2014 [NASA ADS] [Google Scholar]
- Pitjeva, E. V. 2005, Sol. Syst. Res., 39, 176 [NASA ADS] [CrossRef] [Google Scholar]
- Pitjeva, E. V. 2010, eds. S. A. Klioner, P. K. Seidelmann, & M. H. Soffel, Proc. IAU Symp., 261, 170 [NASA ADS] [Google Scholar]
- Pitjeva, E. V. 2013, Sol. Syst. Res., 47, 386 [CrossRef] [Google Scholar]
- Russell, C. T., Raymond, C. A., Ammannito, E., et al. 2016, Science, 353, 1008 [NASA ADS] [CrossRef] [Google Scholar]
- Schenk, P., O’Brien, D. P., Marchi, S., et al. 2012, Science, 336, 694 [NASA ADS] [CrossRef] [Google Scholar]
- Schmidt, R. M., & Housen, K. R. 1987, Int. J. Impact Eng., 5, 543 [NASA ADS] [CrossRef] [Google Scholar]
- Sierks, H., Lamy, P., Barbieri, C., et al. 2011, Science, 334, 487 [NASA ADS] [CrossRef] [Google Scholar]
- Siltala, L., & Granvik, M. 2017, Icarus, 297, 149 [NASA ADS] [CrossRef] [Google Scholar]
- Spoto, F., Milani, A., & Knežević, Z. 2015, Icarus, 257, 275 [NASA ADS] [CrossRef] [Google Scholar]
- Taylor, R. C. 1977, AJ, 82, 441 [NASA ADS] [CrossRef] [Google Scholar]
- Thalmann, C., Schmid, H. M., Boccaletti, A., et al. 2008, in Ground-based and Airborne Instrumentation for Astronomy II, Proc. SPIE, 7014, 70143F [Google Scholar]
- Thomas, P. C. 1999, Icarus, 142, 89 [NASA ADS] [CrossRef] [Google Scholar]
- van Houten-Groeneveld, I., & van Houten, C. J. 1958, ApJ, 127, 253 [NASA ADS] [CrossRef] [Google Scholar]
- Vasiliev, M. V., & Yagudina, E. I. 1999, in Communications of IAA of RAS [Google Scholar]
- Vernazza, P., Zanda, B., Binzel, R. P., et al. 2014, ApJ, 791, 120 [NASA ADS] [CrossRef] [Google Scholar]
- Vernazza, P., Brož, M., Drouard, A., et al. 2018, A&A, 618, A154 [NASA ADS] [CrossRef] [EDP Sciences] [Google Scholar]
- Veverka, J., Robinson, M., Thomas, P., et al. 2000, Meteoritics Planet. Sci., 35, Suppl., p.A164, 35 [Google Scholar]
- Viikinkoski, M. 2016, PhD thesis, Tampere University of Technology [Google Scholar]
- Viikinkoski, M., Kaasalainen, M., & Ďurech, J. 2015a, A&A, 576, A8 [NASA ADS] [CrossRef] [EDP Sciences] [Google Scholar]
- Viikinkoski, M., Kaasalainen, M., Ďurech, J., et al. 2015b, A&A, 581, L3 [NASA ADS] [CrossRef] [EDP Sciences] [Google Scholar]
- Viikinkoski, M., Hanuš, J., Kaasalainen, M., Marchis, F., & Ďurech, J. 2017, A&A, 607, A117 [NASA ADS] [CrossRef] [EDP Sciences] [Google Scholar]
- Viikinkoski, M., Vernazza, P., Hanuš, J., et al. 2018, A&A, 619, L3 [NASA ADS] [CrossRef] [EDP Sciences] [Google Scholar]
- Vincent, J.-B., Schenk, P., Nathues, A., et al. 2014, Planet. Space Sci., 103, 57 [NASA ADS] [CrossRef] [Google Scholar]
- Viswanathan, V., Fienga, A., Gastineau, M., & Laskar, J. 2017, Notes Scientifiques et Techniques de l’Institut de mécanique céleste, ISBN 2-910015-79-3, 39, 108 [Google Scholar]
- Vokrouhlický, D., Brož, M., Bottke, W. F., Nesvorný, D., & Morbidelli, A. 2006, Icarus, 182, 118 [NASA ADS] [CrossRef] [Google Scholar]
- Vokrouhlický, D., Bottke, W. F., Chesley, S. R., Scheeres, D. J., & Statler, T. S. 2015, in Asteroids IV, eds. P. Michel, F. E. DeMeo, & W. F. Bottke (Tucson: The University of Arizona Press), 509 [Google Scholar]
- Witasse, O., Lebreton, J.-P., Bird, M. K., et al. 2006, J. Geophys. Res. Planets, 111, 7 [CrossRef] [Google Scholar]
- Zhou, X. H., Yang, X. Y., & Wu, Z. X. 1982, Acta Astron. Sin., 23, 349 [NASA ADS] [Google Scholar]
- Zielenbach, W. 2011, AJ, 142, 120 [NASA ADS] [CrossRef] [Google Scholar]
All Tables
Volume-equivalent diameter (D), dimensions along the major axis (a, b, c), sidereal rotation period (P), spin-axis ecliptic J2000 coordinates (longitude λ and latitude β), mass (m), and bulk density (ρ) of Iris as determined here, compared with values from the works of Ostro et al. (2010) and Viikinkoski et al. (2017).
Size and bulk density estimates of large S-type asteroids compiled from the literature.
All Figures
|
Fig. 1 VLT/SPHERE/ZIMPOL images of (7) Iris obtained on October 10 and 11, 2017, and deconvolved with the Mistral algorithm. See Table C.1 for details on the observing conditions. |
| In the text | |
|
Fig. 2 Comparison between the VLT/SPHERE/ZIMPOL deconvolved images of Iris (bottom panel) and the corresponding projections of our ADAM shape model (top panel). The red line indicates the position of the rotation axis. We use a nonrealistic illumination to highlight the local topography of the model. The selected illumination significantly enhances the ridge that spreads from the top to the bottom of the projections on the left-hand side of the figure. This ridge is a minor modeling artifact caused by the limited number of observing geometries sampled by SPHERE. |
| In the text | |
|
Fig. 3 Visualization of the shape model of Iris from a southern pole-on view (left), and from the geometry of the second epoch of observation (rotation phase 0.03, right). We embedded the shape projection within a circle to highlight the excavated part and included the z-axis orientation. |
| In the text | |
|
Fig. 4 Identified and proposed surface features on Iris. Putative impact craters are indicated by names and often with a contour showing the estimated area they cover. Candidates for impact craters are indicated by white-font letters and contours, in italic if the contours were not clearly defined. A question mark indicates the expected position of a feature that could not be identified on the image, likely due to unfavorable illumination. |
| In the text | |
|
Fig. A.1 Vicinity of (7) Iris in the ap vs. sin Ip space of proper orbital elements. The eccentricity range is ep ∈ (0.162;0.262). Asteroids with albedo within ± 0.1 of the Iris value (pV = 0.252), are plotted in yellow, with symbol size proportional to the body diameter. Asteroids with unknown albedo are plotted as gray dots. The family visible at sin Ip ≐ 0.09 is related to the dark C-type asteroid (163) Erigone. The dashed ellipse corresponds to the escape velocity from Iris, vesc ≐ 130 m s−1, converted to orbital elements using the Gauss equations. This velocity was computed for true anomaly f = 180° and argument of perihelion ω = 0°. |
| In the text | |
|
Fig. B.1 Number of simulations in which particular events were detected: (i) the ejected mass Mej over the parent-body mass Mpb was > 1%; (ii) the projectile diameter was dp > 2.0 km. The former is related to the shape of (7) Iris, the latter to the number of impact craters >30 km on Iris. |
| In the text | |
|
Fig. C.1 Comparison between the Keck/NIRC2 and VLT/NaCo deconvolved images of Iris (rows 2 and 4), and the corresponding projections of our shape model (rows 1 and 3). The red line indicates the position of the rotation axis. Data affected by deconvolution artifacts were not used for the shape modeling. |
| In the text | |
|
Fig. C.2 Reliable bulk density measurements for 21 S-type asteroids compiled from the literature. |
| In the text | |
|
Fig. C.3 Comparison between the VLT/SPHERE/ZIMPOL deconvolved images of Iris (middle panel) and the corresponding projections of our shape model (top panel), and the shape model of Ostro et al. (2010) based on delay-Doppler data collected with Arecibo (bottom panel). The red line indicates the position of the rotation axis. We used a nonrealistic illumination to highlight the local topography of the models. We highlight the main topographic features. |
| In the text | |
Current usage metrics show cumulative count of Article Views (full-text article views including HTML views, PDF and ePub downloads, according to the available data) and Abstracts Views on Vision4Press platform.
Data correspond to usage on the plateform after 2015. The current usage metrics is available 48-96 hours after online publication and is updated daily on week days.
Initial download of the metrics may take a while.