Fig. 8
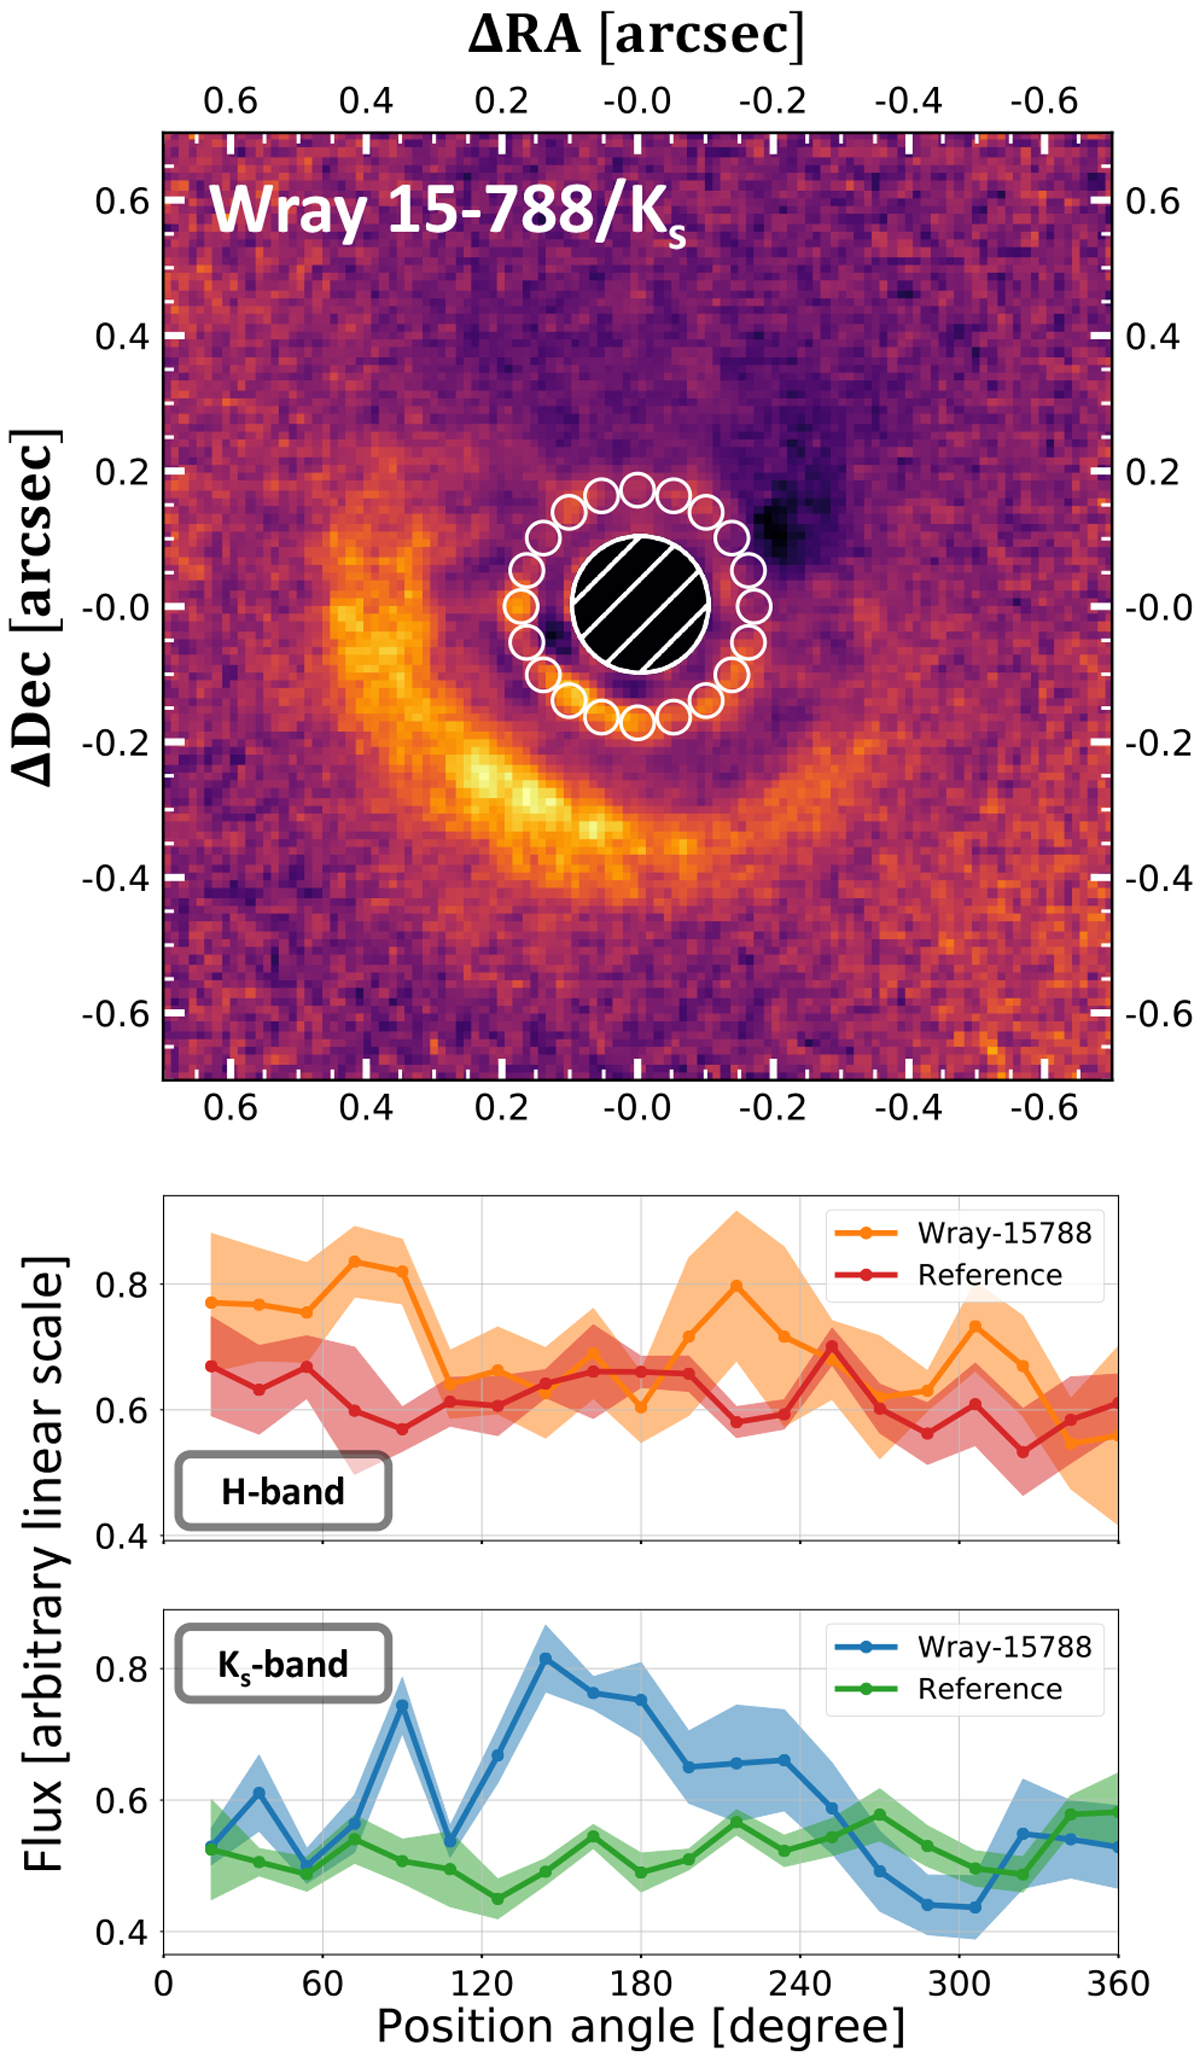
Comparison to average images obtained from reduced reference library targets. Top panel: locations of the flux apertures that are distributed alongside ring B (white circles). Bottom panels: flux measurements in the apertures from the top panel as a function of position angle. The solid lines correspond to the average flux per aperture. The envelope indicates the corresponding standard deviation.
Current usage metrics show cumulative count of Article Views (full-text article views including HTML views, PDF and ePub downloads, according to the available data) and Abstracts Views on Vision4Press platform.
Data correspond to usage on the plateform after 2015. The current usage metrics is available 48-96 hours after online publication and is updated daily on week days.
Initial download of the metrics may take a while.