Fig. 6
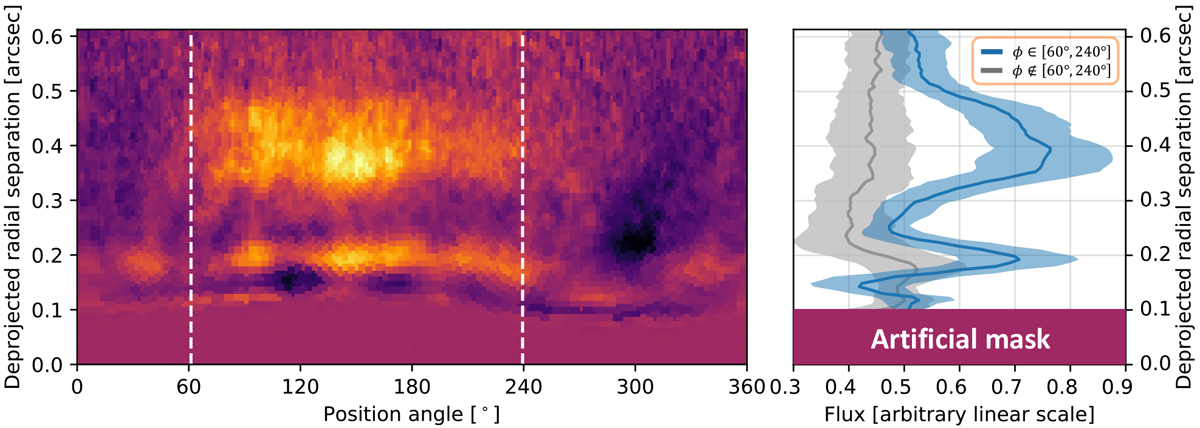
Left panel: polar projection of the SPHERE/CI result in Ks band. The image is corrected for the offset and the inclination of the best fit ellipse to ring A. The white dashed lines indicate the range of position angles in which we detect scattered light flux from ring A with an S/N higher than 5. Right panel: radial brightness profile of the disk and background noise. The blue curve shows the averaged disk signal for position angles in the range of 60° ≤ ϕ ≤ 240° and the gray curve represents the average noise over all remaining position angles. The envelopes indicate the corresponding standard deviations.
Current usage metrics show cumulative count of Article Views (full-text article views including HTML views, PDF and ePub downloads, according to the available data) and Abstracts Views on Vision4Press platform.
Data correspond to usage on the plateform after 2015. The current usage metrics is available 48-96 hours after online publication and is updated daily on week days.
Initial download of the metrics may take a while.