Fig. 4
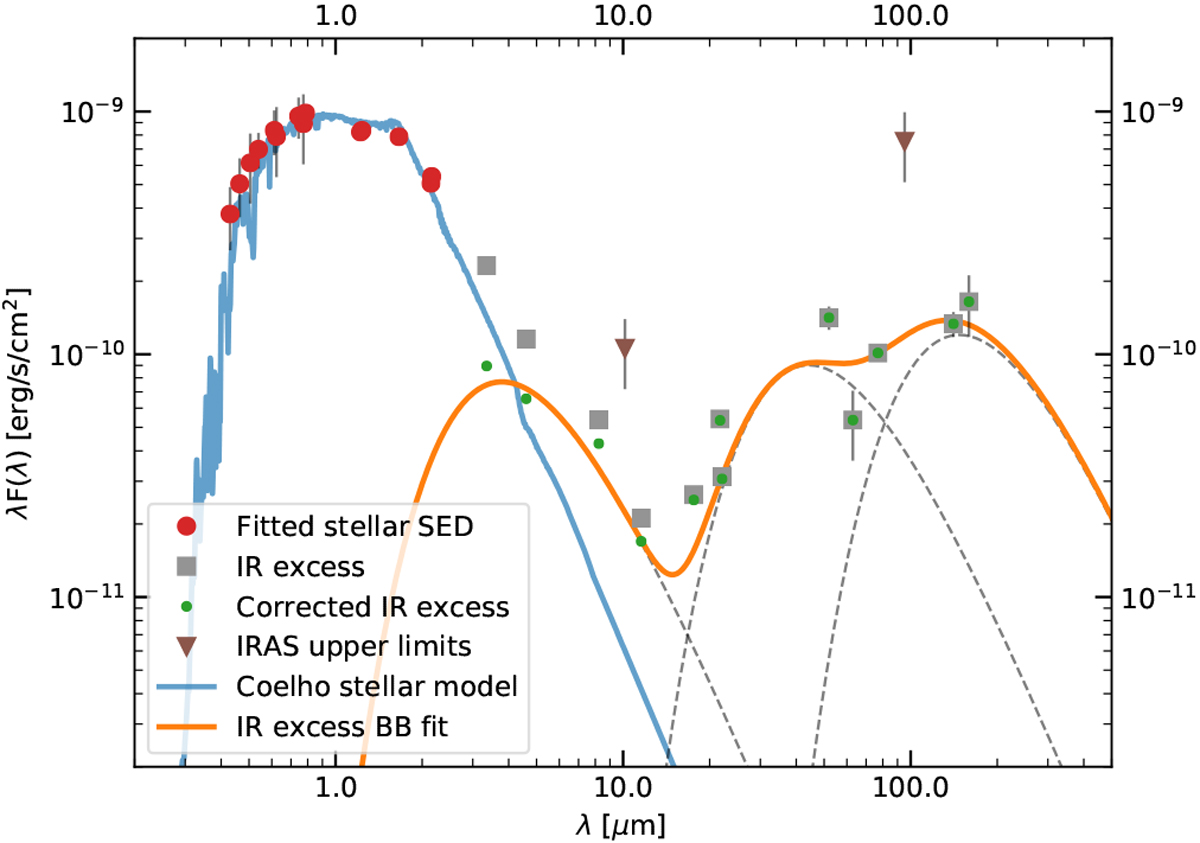
De-reddened spectral energy distribution of Wray 15-788. The blue curve shows a Coelho stellar model (Coelho 2014) with Teff = 4250 K, log (g) = 4.5, [Fe/H] = 0, [α/Fe] = 0, and AV = 0.74 that isfitted to the red data points from the APASS, Gaia, 2MASS, and DENIS photometry. The gray squares denote flux measurements from WISE, IRAS, AKARI/FIS, and AKARI/IRC, and the brown triangles provide upper limits from IRAS. Three blackbodies with Tdust, 1 = 969 K, Tdust, 2 = 83 K, and Tdust, 3 = 25 K were simultaneously fitted to the green data points that denote the object’s far-infrared excess, corrected for stellar contamination. The individual blackbody functions are indicated by the dashed gray lines, whereas their sum is presented by the solid orange curve.
Current usage metrics show cumulative count of Article Views (full-text article views including HTML views, PDF and ePub downloads, according to the available data) and Abstracts Views on Vision4Press platform.
Data correspond to usage on the plateform after 2015. The current usage metrics is available 48-96 hours after online publication and is updated daily on week days.
Initial download of the metrics may take a while.