Fig. 6.
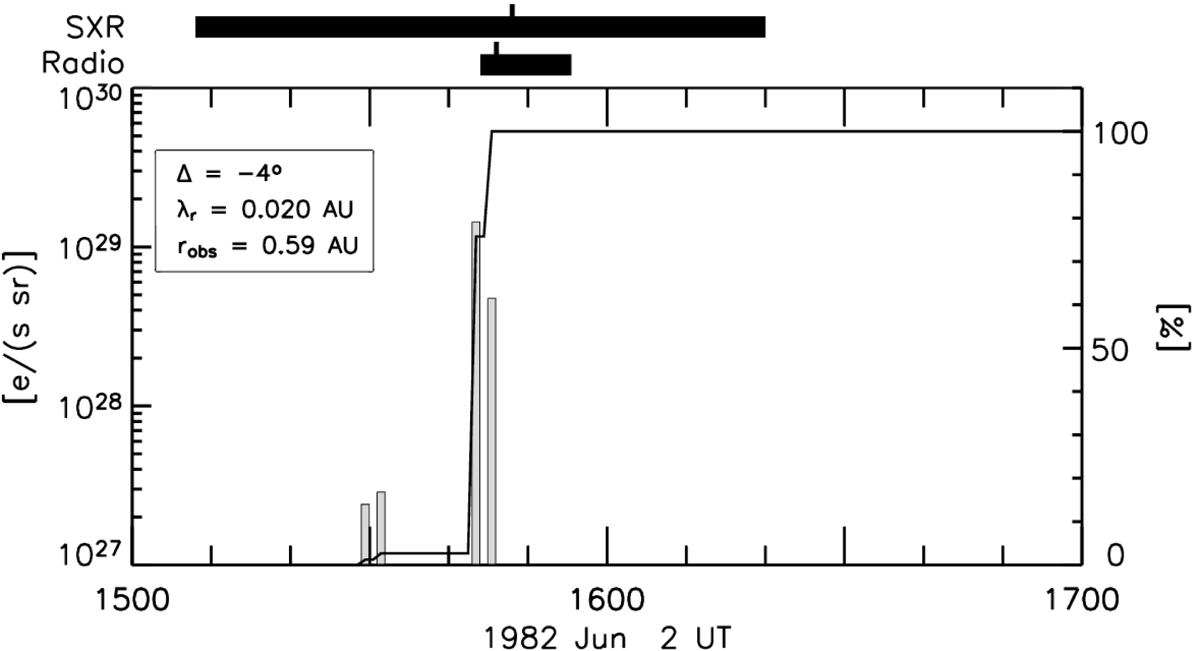
Release time profile inferred for the event on 1982 June 2. The histogram shows the inversion result with 1-min time resolution; the solid curve shows the accumulated percentage of injected electrons as a function of time. The profile has been shifted by +8 min to allow the comparison with EM emissions. Black thick horizontal bars on the top of the panel show the timing of the SXR and radio emissions. The time of the EM peaks are indicated with vertical lines. The legend shows the connectivity of the source (Δ), the inferred radial mean free path and the radial distance of the spacecraft.
Current usage metrics show cumulative count of Article Views (full-text article views including HTML views, PDF and ePub downloads, according to the available data) and Abstracts Views on Vision4Press platform.
Data correspond to usage on the plateform after 2015. The current usage metrics is available 48-96 hours after online publication and is updated daily on week days.
Initial download of the metrics may take a while.