Free Access
Fig. 5.
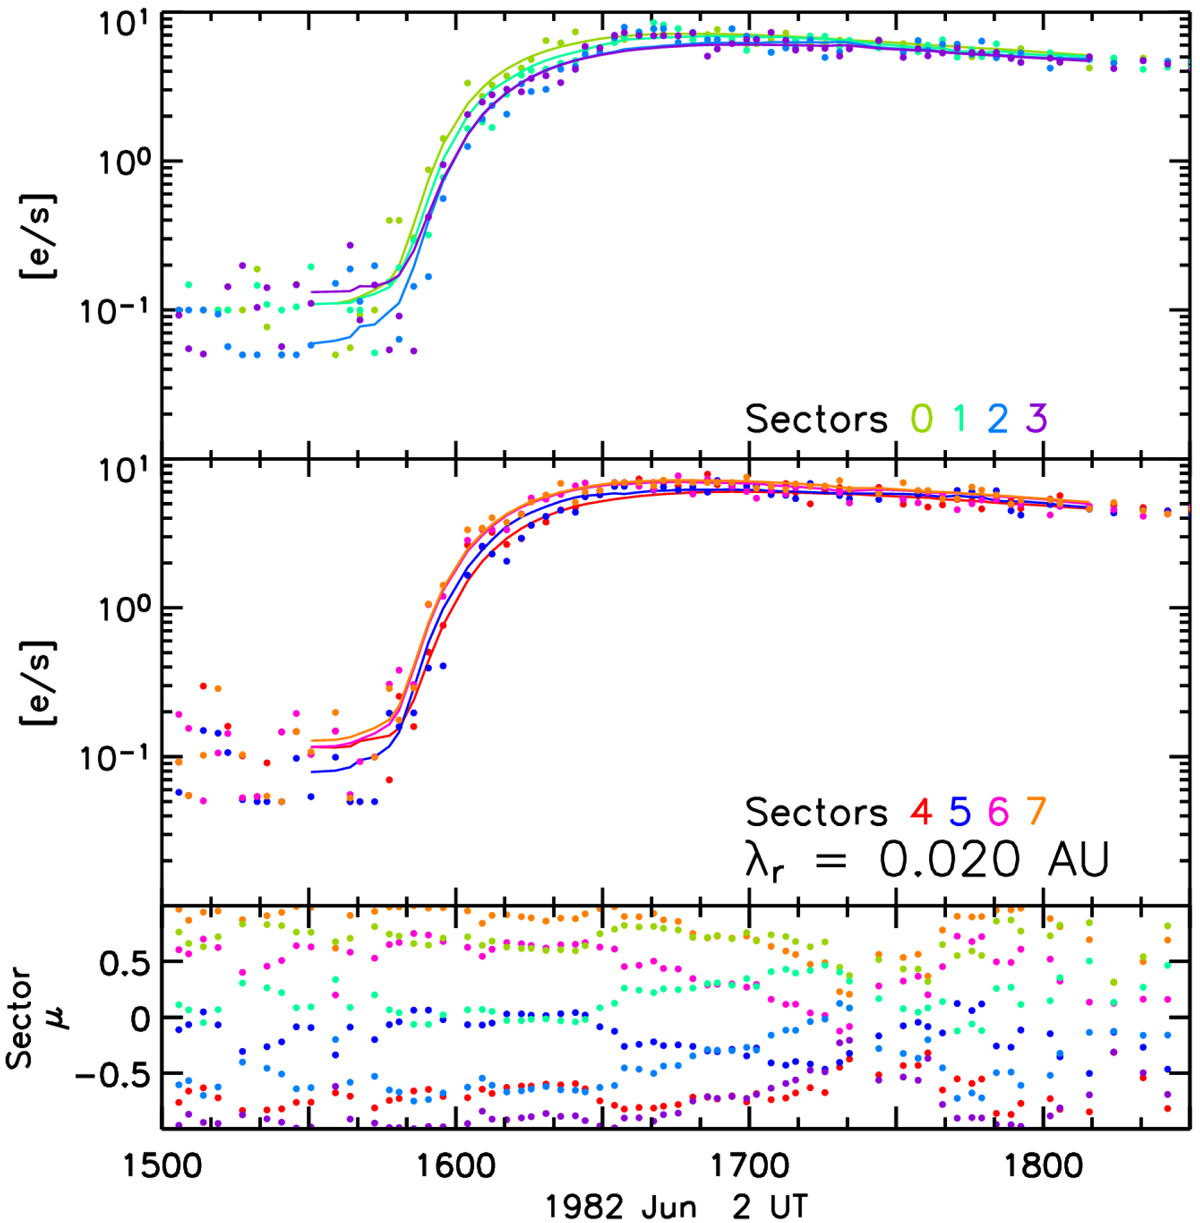
Top two panels: observational sectored data (dots) and model predictions (coloured curves) on 1982 June 2. Bottom panel: electron pitch-angle cosine observed by the midpoint clock-angle of each sector with the same colour code.
Current usage metrics show cumulative count of Article Views (full-text article views including HTML views, PDF and ePub downloads, according to the available data) and Abstracts Views on Vision4Press platform.
Data correspond to usage on the plateform after 2015. The current usage metrics is available 48-96 hours after online publication and is updated daily on week days.
Initial download of the metrics may take a while.