Free Access
Fig. 3.
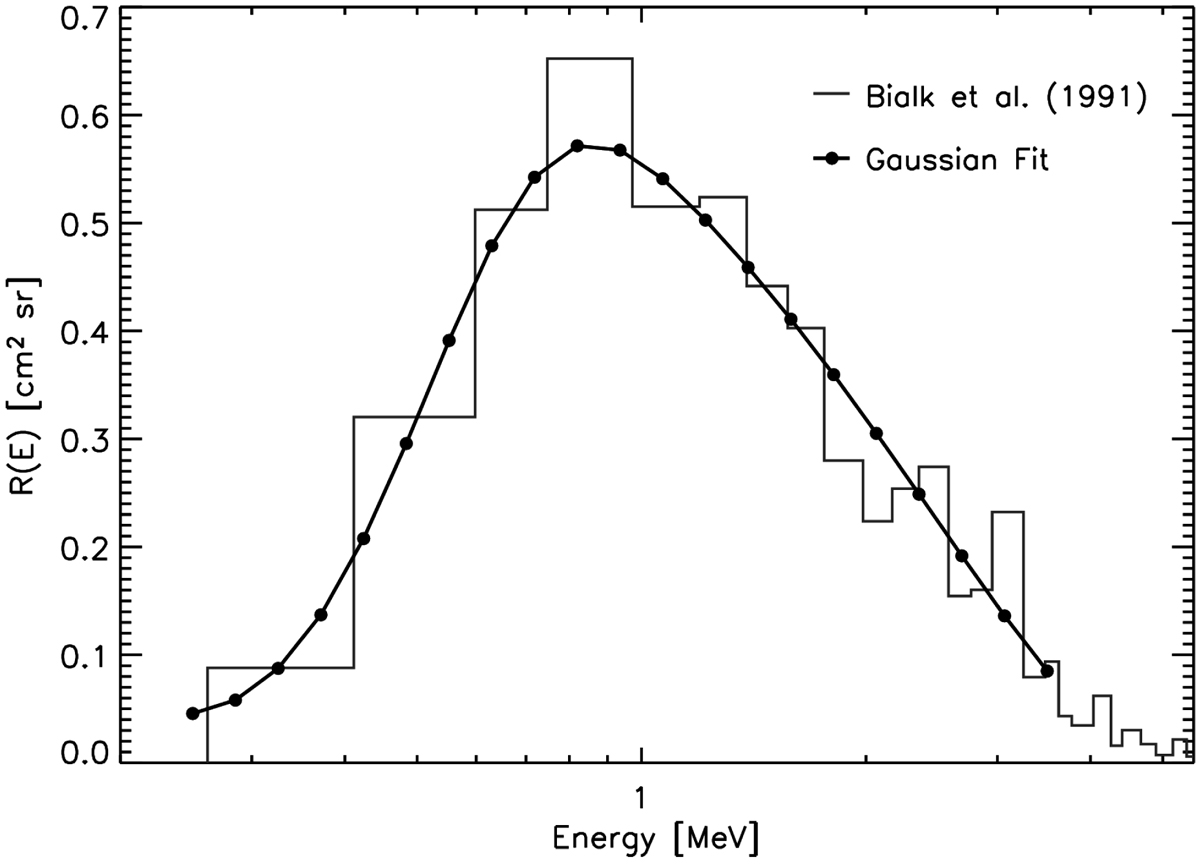
Energy response for channel E03 of the E6 experiment on board Helios. The histogram (grey) shows the energy response computed by Bialk et al. (1991), the black solid curve shows a 6-parameter Gaussian fit, and dots display the response values for a grid of 20 logarithmically spaced energies.
Current usage metrics show cumulative count of Article Views (full-text article views including HTML views, PDF and ePub downloads, according to the available data) and Abstracts Views on Vision4Press platform.
Data correspond to usage on the plateform after 2015. The current usage metrics is available 48-96 hours after online publication and is updated daily on week days.
Initial download of the metrics may take a while.