Fig. 2.
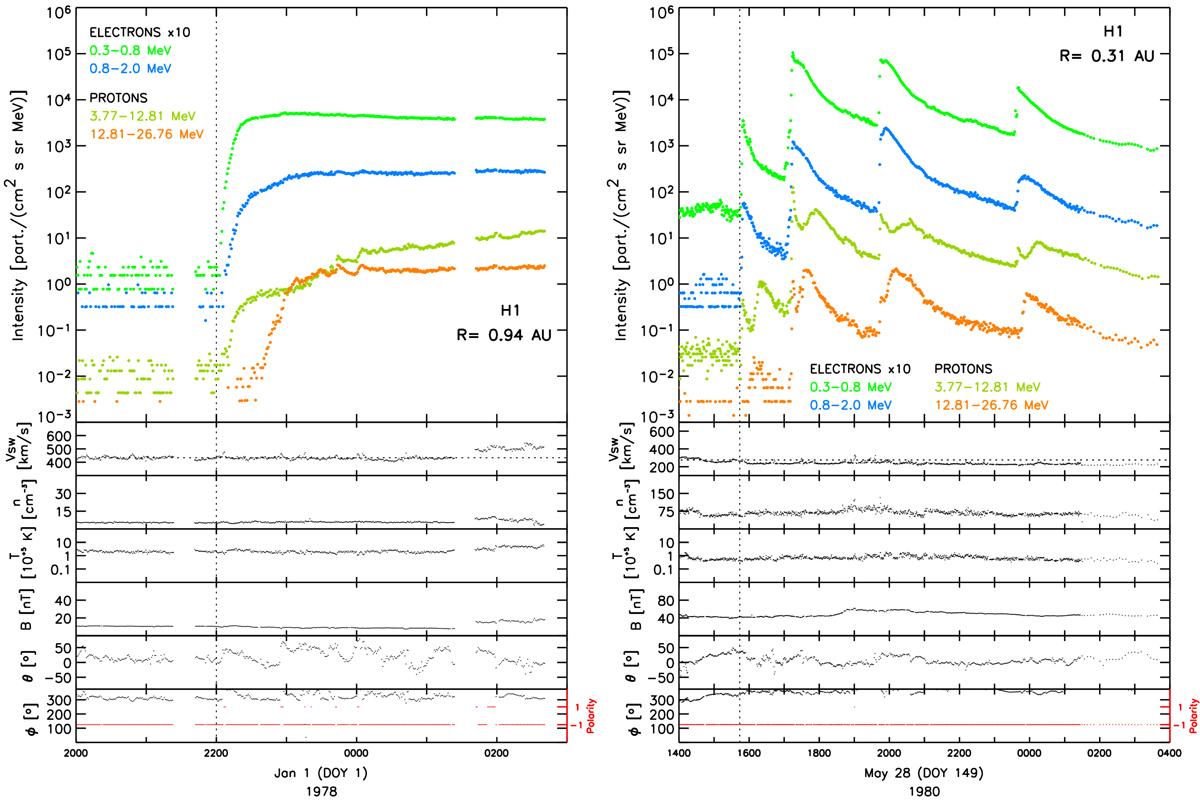
In-situ measurements by Helios 1 on 1978 January 1 (left panel) and on 1980 May 28 (right panel). Top panel: particle intensities for electrons (dots, scaled by a factor of 10) for channels E03 (green) and E08 (blue), and protons (curves) from channels P4 (olive) and P13 (orange), measured by E6. Next panels from top to bottom: proton solar wind speed (horizontal dotted line shows the averaged pre-event speed), density and temperature; magnetic field strength and direction (RTN). Red dotted line in the last panel depict the IMF polarity. The vertical dotted line across all panels indicates the event onset.
Current usage metrics show cumulative count of Article Views (full-text article views including HTML views, PDF and ePub downloads, according to the available data) and Abstracts Views on Vision4Press platform.
Data correspond to usage on the plateform after 2015. The current usage metrics is available 48-96 hours after online publication and is updated daily on week days.
Initial download of the metrics may take a while.