Fig. A.1
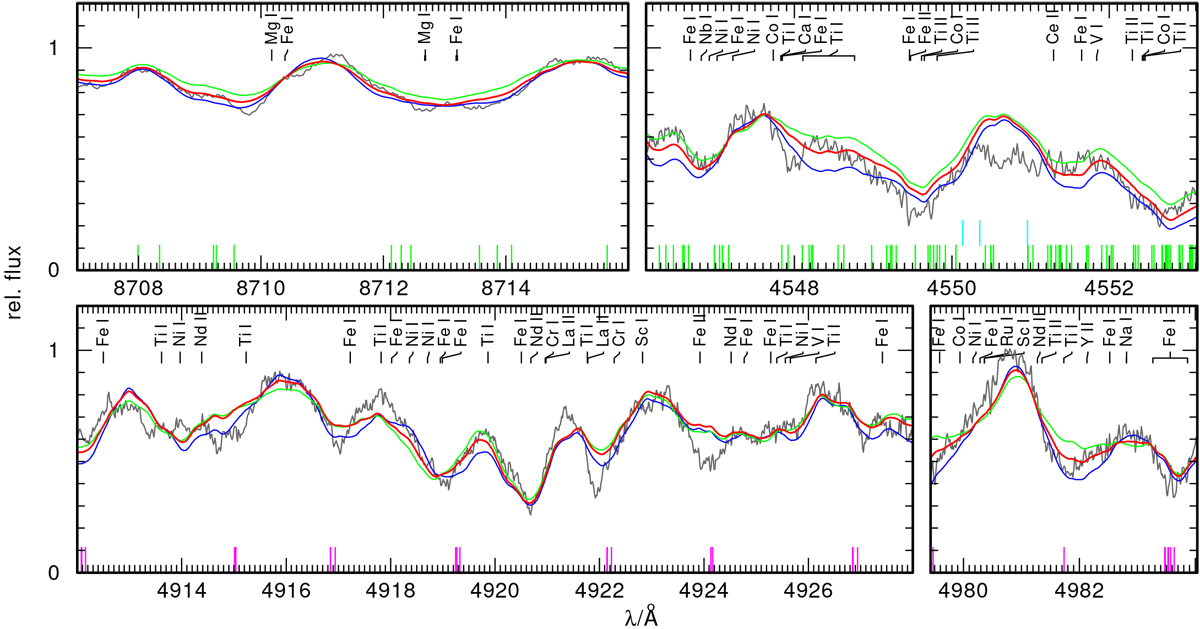
Observation (gray) of Hen 2−39 compared to model spectra with Teff = 4000, 4250, 4500 K (blue, red, green) for selected regions that were used for the determination of Teff. CN, C2, and CH absorption lines are indicated at the bottom in green, purple, and cyan, respectively. All absorption lines that appear with an equivalent width ≥ 20 mÅ in the calculated spectrum are indicated.
Current usage metrics show cumulative count of Article Views (full-text article views including HTML views, PDF and ePub downloads, according to the available data) and Abstracts Views on Vision4Press platform.
Data correspond to usage on the plateform after 2015. The current usage metrics is available 48-96 hours after online publication and is updated daily on week days.
Initial download of the metrics may take a while.