Fig. 8.
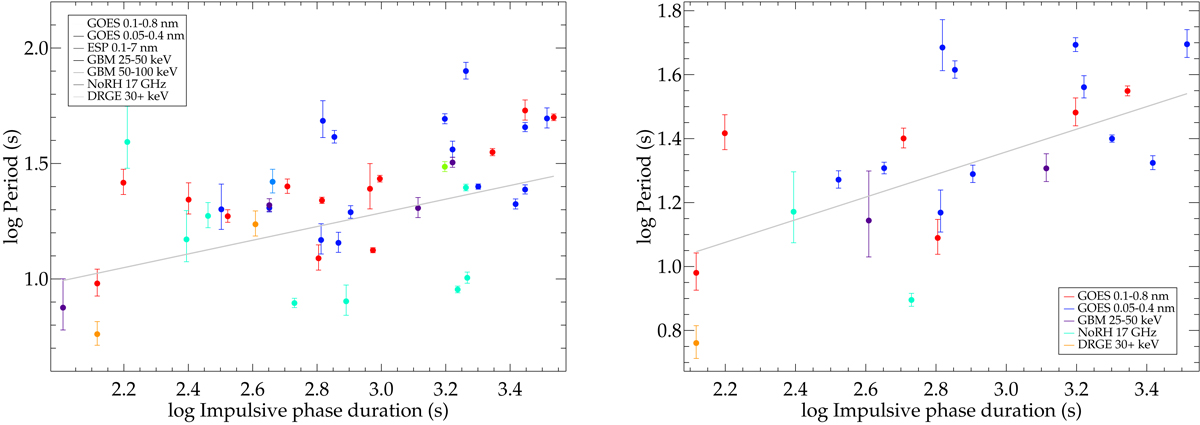
Two variants of the QPP period plotted against the flare impulsive phase duration. Left: full set of 37 flares with QPPs found by Pugh et al. (2017b). The Pearson correlation is 0.53 with a p-value of 0.0002, and the Spearman correlation is 0.50 with a p-value of 0.0006. Right: plot includes only those 20 flares that occurred within ±60° of the solar disc centre, and hence is the same sample of flares used in Figs. 4–7. The Pearson correlation coefficient is 0.56 with a p-value of 0.006, and the Spearman correlation coefficient is 0.65 with a p-value of 0.001.
Current usage metrics show cumulative count of Article Views (full-text article views including HTML views, PDF and ePub downloads, according to the available data) and Abstracts Views on Vision4Press platform.
Data correspond to usage on the plateform after 2015. The current usage metrics is available 48-96 hours after online publication and is updated daily on week days.
Initial download of the metrics may take a while.