Fig. 4.
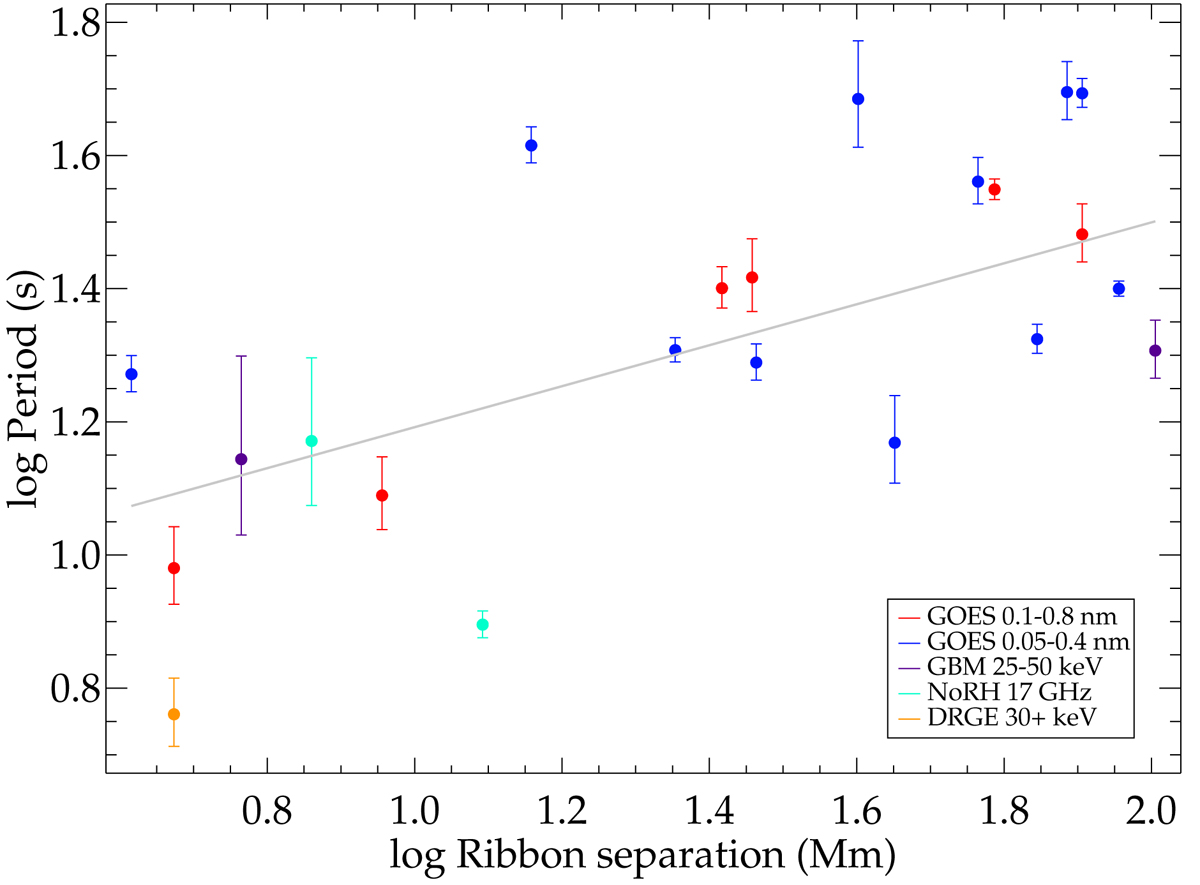
QPP periods plotted against the separation of the geometric centroids of the two flare ribbons. The differently coloured points correspond to the different instruments used to detect the QPP signals, and the grey line is a linear fit in log space. The Pearson correlation is 0.53 with a p-value of 0.01, and the Spearman correlation is 0.64 with a p-value of 0.001.
Current usage metrics show cumulative count of Article Views (full-text article views including HTML views, PDF and ePub downloads, according to the available data) and Abstracts Views on Vision4Press platform.
Data correspond to usage on the plateform after 2015. The current usage metrics is available 48-96 hours after online publication and is updated daily on week days.
Initial download of the metrics may take a while.