Fig. A.1.
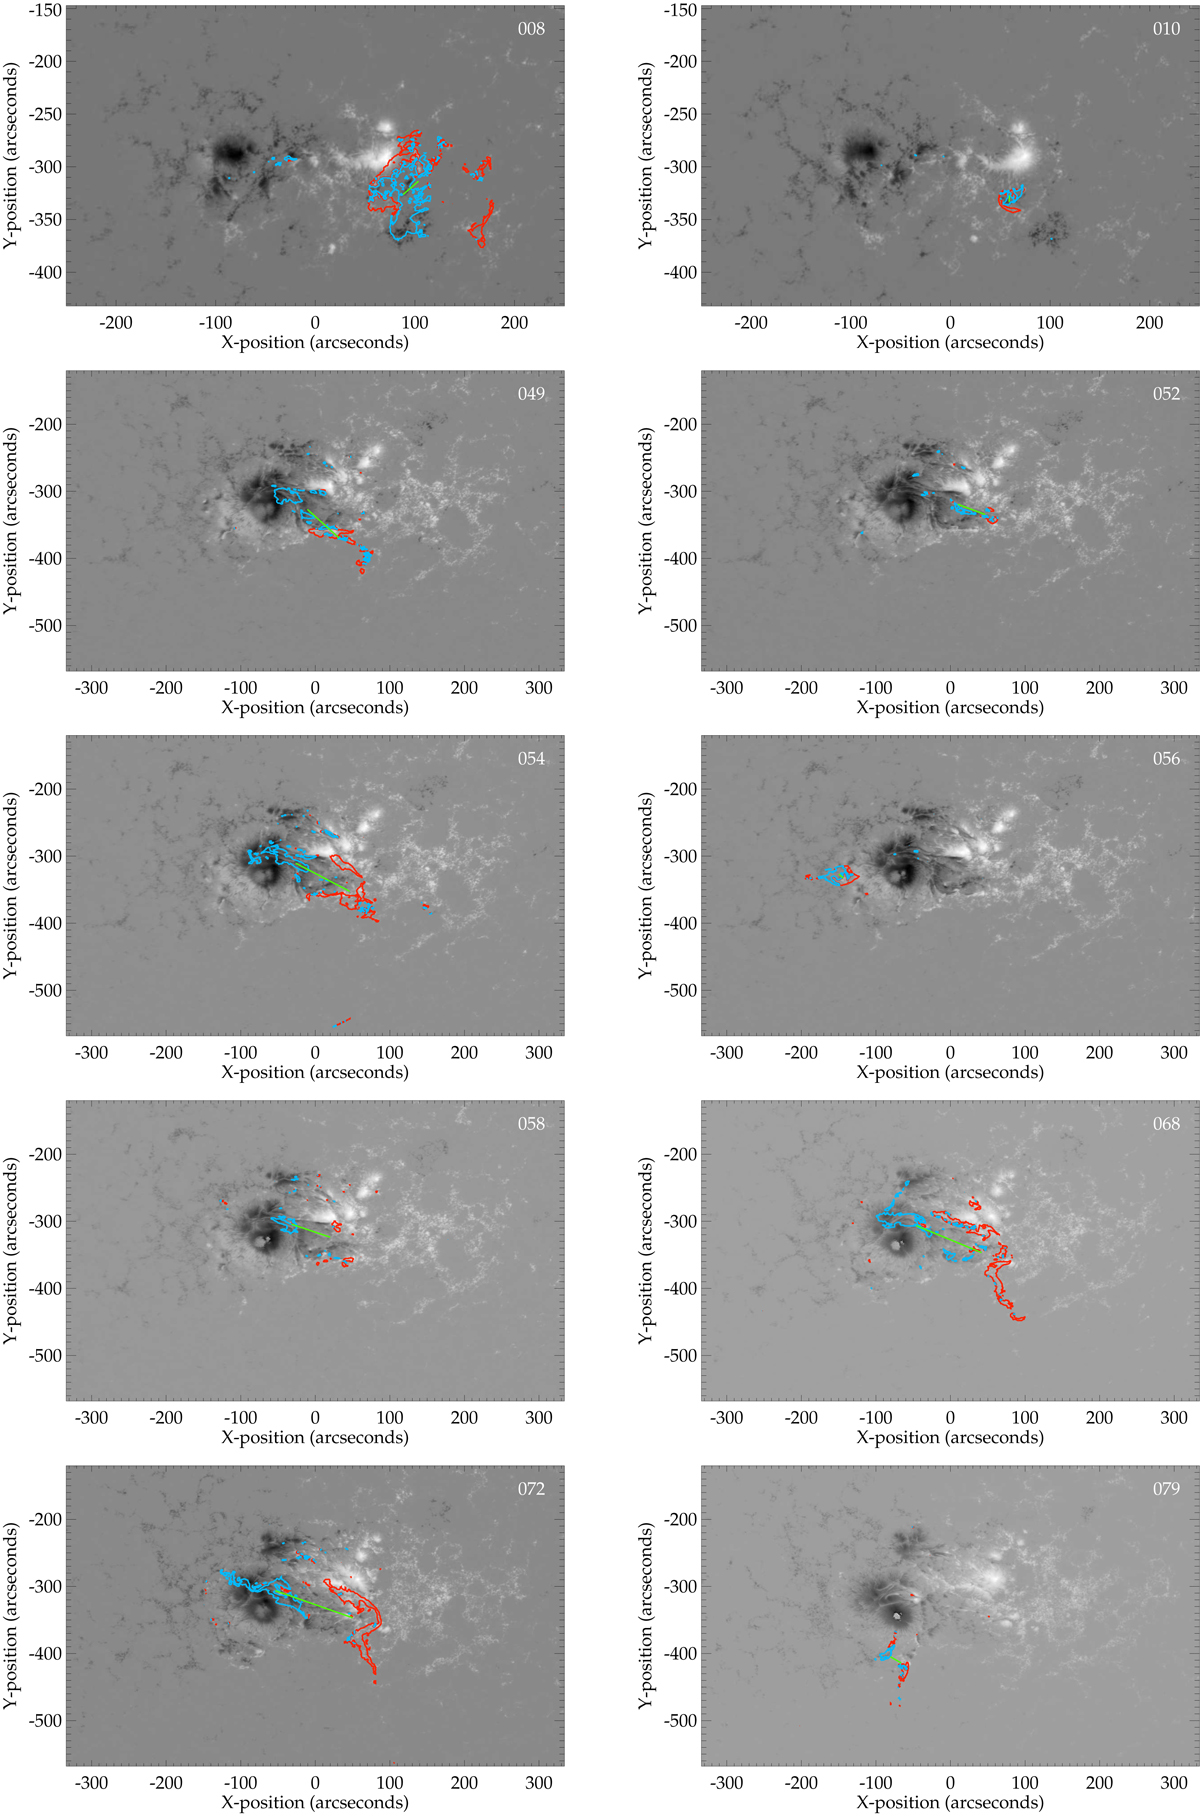
HMI magnetograms for all flares listed in Table 1, showing the host active region at the time of the flare peak in the GOES 1–8 Å waveband. The red and blue contours show the positions of the composite flare ribbons with positive and negative magnetic polarity, respectively. The green lines join the geometric centroids of the positive- and negative-polarity ribbon components.
Current usage metrics show cumulative count of Article Views (full-text article views including HTML views, PDF and ePub downloads, according to the available data) and Abstracts Views on Vision4Press platform.
Data correspond to usage on the plateform after 2015. The current usage metrics is available 48-96 hours after online publication and is updated daily on week days.
Initial download of the metrics may take a while.