Fig. 10.
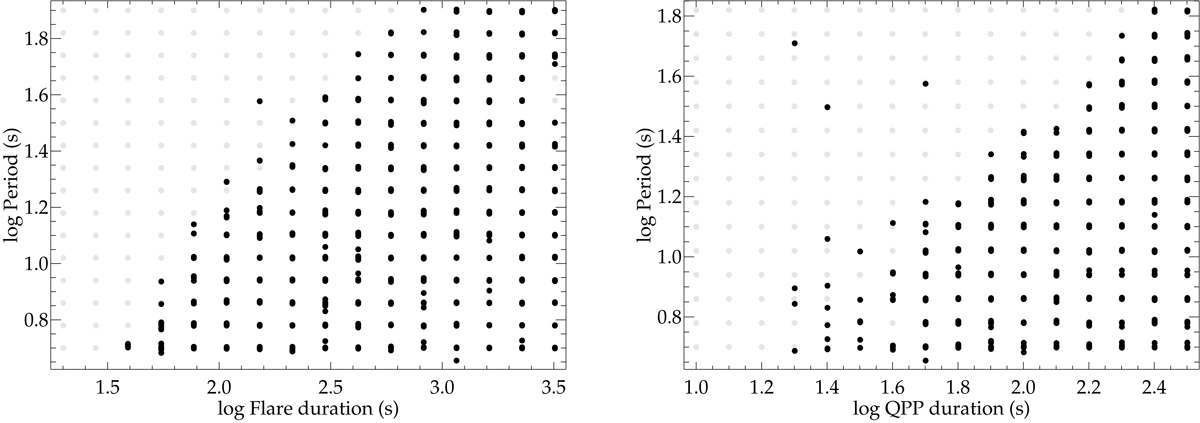
Simulated flare QPP period plotted against the flare duration (left) and QPP signal duration (right). The grey points represent the input parameters of the simulated flares with QPPs, while the black points represent the simulated flares with QPP signals that were detected using the method described in Sect. 3.2. Left: the Pearson correlation is 0.23 with a p-value of 0.0, and the Spearman correlation is 0.30 with a p-value of 4 × 10⁻²⁷. Right: the Pearson correlation is 0.31 with a p-value of 0.0, and the Spearman correlation is 0.30 with a p-value of 3 × 10⁻²⁷.
Current usage metrics show cumulative count of Article Views (full-text article views including HTML views, PDF and ePub downloads, according to the available data) and Abstracts Views on Vision4Press platform.
Data correspond to usage on the plateform after 2015. The current usage metrics is available 48-96 hours after online publication and is updated daily on week days.
Initial download of the metrics may take a while.