Fig. 4.
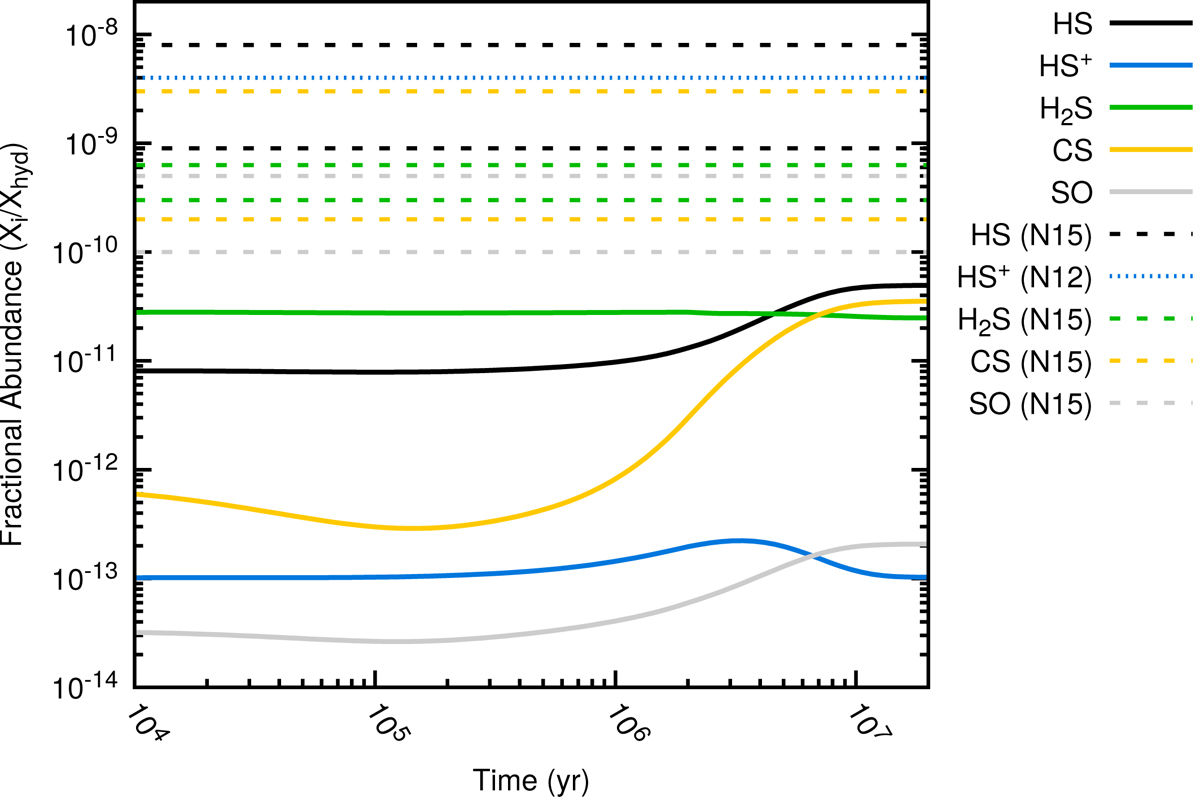
Comparison of model (solid curves) vs. observations (dashes) for a diffuse cloud environment. The thin dashed lines serve as upper limits of observations, and the thick dashed lines function in pairs as a range of observational values. See text for details. The references refer to: (N12; Neufeld et al. 2012); (N15; Neufeld et al. 2015).
Current usage metrics show cumulative count of Article Views (full-text article views including HTML views, PDF and ePub downloads, according to the available data) and Abstracts Views on Vision4Press platform.
Data correspond to usage on the plateform after 2015. The current usage metrics is available 48-96 hours after online publication and is updated daily on week days.
Initial download of the metrics may take a while.