Fig. 3.
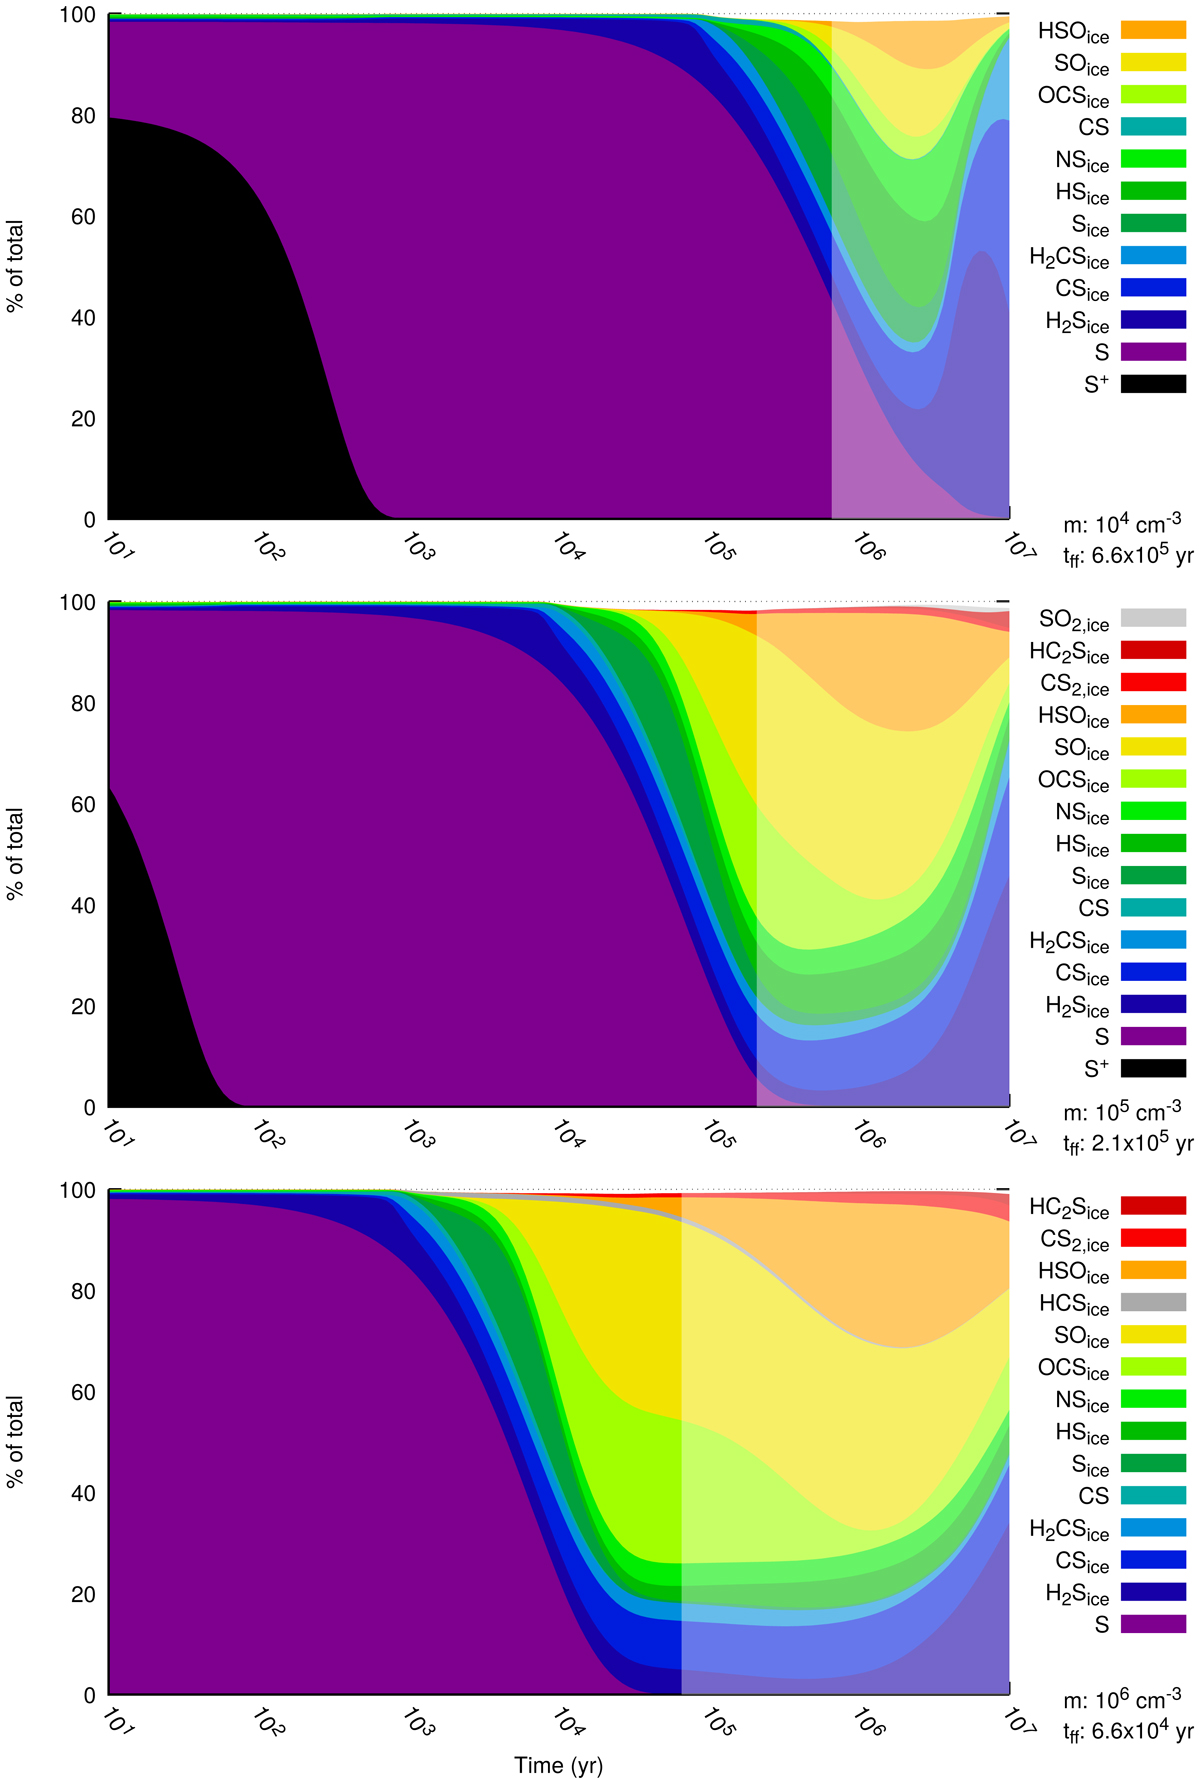
Primary S-carrying species from the molecule as a function of time and different volume densities (from 104 cm−3, top, to 106 cm−3, bottom) during Stage 3. The vertical width of each component represents how much sulfur is accounted for. We have also used partially opaque boxes to highlight the timescale that is defined by the free fall time of a homogeneous cloud to collapse under ideal gravitational conditions (![]() , i.e., ignoring magnetic fields, angular momentum, and other resistive effects), for reference to other models. The gas number densities, m, and approximate free fall time limits, tff, are noted for each plot.
, i.e., ignoring magnetic fields, angular momentum, and other resistive effects), for reference to other models. The gas number densities, m, and approximate free fall time limits, tff, are noted for each plot.
Current usage metrics show cumulative count of Article Views (full-text article views including HTML views, PDF and ePub downloads, according to the available data) and Abstracts Views on Vision4Press platform.
Data correspond to usage on the plateform after 2015. The current usage metrics is available 48-96 hours after online publication and is updated daily on week days.
Initial download of the metrics may take a while.