Fig. 9
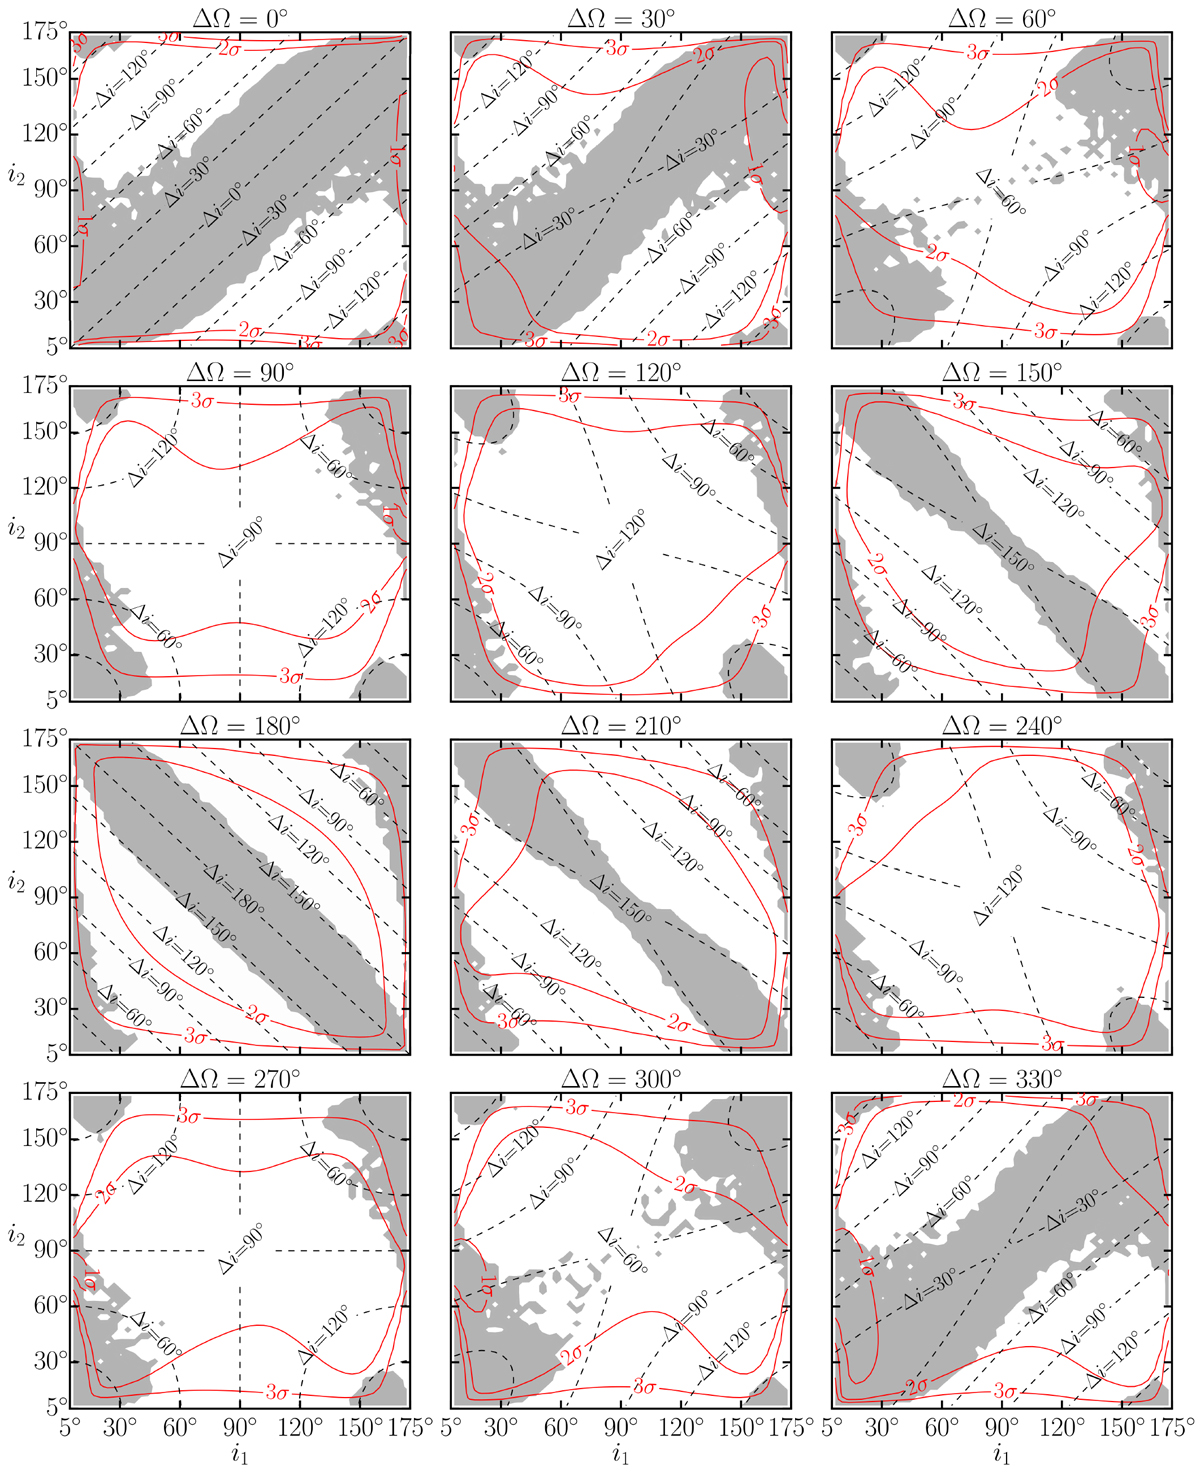
Mutually inclined grids for different ΔΩ. The red contours illustrate the 1σ, 2σ, and 3σ confidence levels, while the black dashed lines delineate constant values of the initial mutual inclination Δi. The stability of the best-fit solution for each grid point is tested for 1 Myr, and gray filled contours show the grid areas where the orbits are stable. See text for details.
Current usage metrics show cumulative count of Article Views (full-text article views including HTML views, PDF and ePub downloads, according to the available data) and Abstracts Views on Vision4Press platform.
Data correspond to usage on the plateform after 2015. The current usage metrics is available 48-96 hours after online publication and is updated daily on week days.
Initial download of the metrics may take a while.