Fig. 6
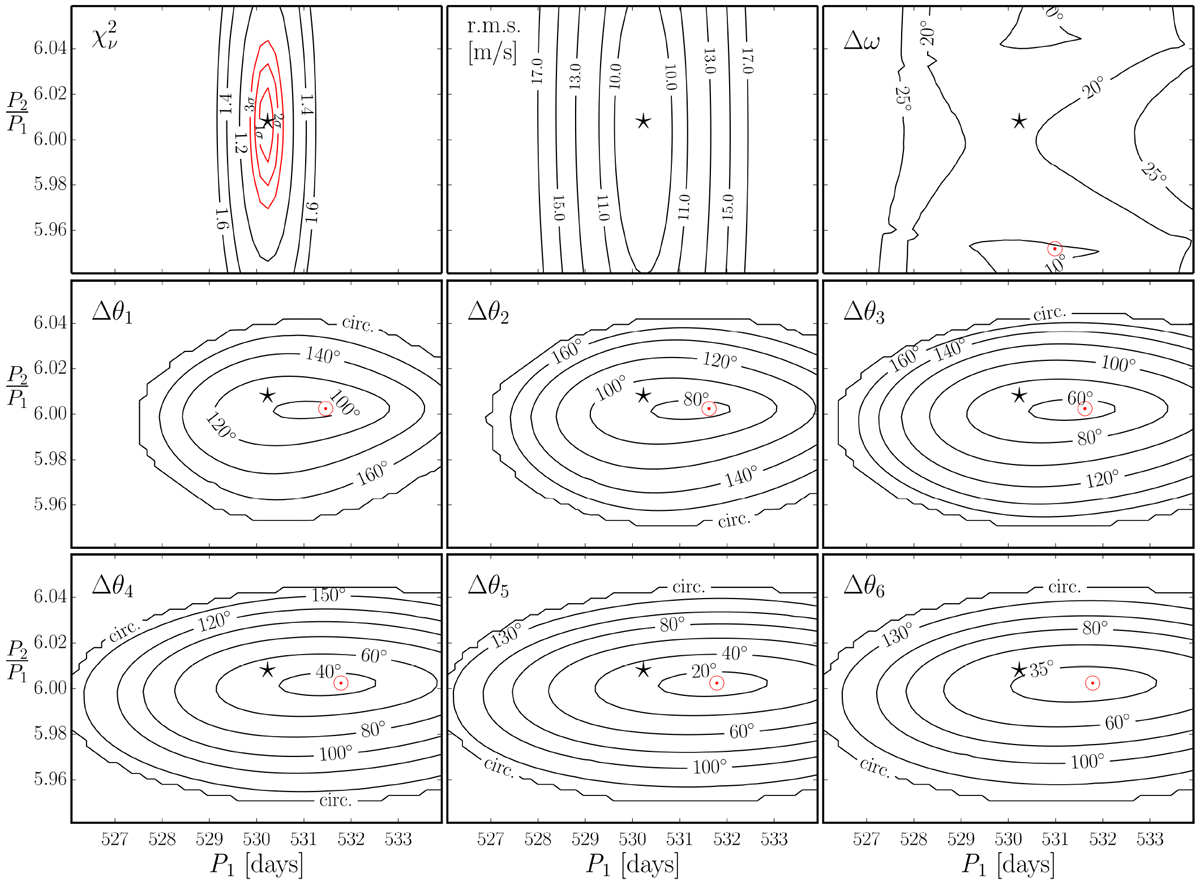
Results from the P2∕P1 vs. P1 grid constructed from coplanar edge-on dynamical fits. The separate panels are self-explanatory: Top-left panel: ![]() grid surfaces, where the red contours denote the 1σ, 2σ, and 3σ levels from the grid’s best fit. The best fit itself is found near the 6:1 period ratio and is marked with a black star symbol in all panels. The RV rms contour levels show consistency with the
grid surfaces, where the red contours denote the 1σ, 2σ, and 3σ levels from the grid’s best fit. The best fit itself is found near the 6:1 period ratio and is marked with a black star symbol in all panels. The RV rms contour levels show consistency with the ![]() surface, with lower rms values found around the best fit. Other panels: all the 6:1 MMR resonance angles (the secular Δω and θ1 –θ6), and their libration semi-amplitudes on the grid. The red ⊙ symbol marks the minimum libration amplitude for each resonant angle. These plots show that almost all fits within the formal 3σ confidence level exhibit resonance behavior with all six 6:1 MMR angles librating. See text for details.
surface, with lower rms values found around the best fit. Other panels: all the 6:1 MMR resonance angles (the secular Δω and θ1 –θ6), and their libration semi-amplitudes on the grid. The red ⊙ symbol marks the minimum libration amplitude for each resonant angle. These plots show that almost all fits within the formal 3σ confidence level exhibit resonance behavior with all six 6:1 MMR angles librating. See text for details.
Current usage metrics show cumulative count of Article Views (full-text article views including HTML views, PDF and ePub downloads, according to the available data) and Abstracts Views on Vision4Press platform.
Data correspond to usage on the plateform after 2015. The current usage metrics is available 48-96 hours after online publication and is updated daily on week days.
Initial download of the metrics may take a while.