Fig. 5
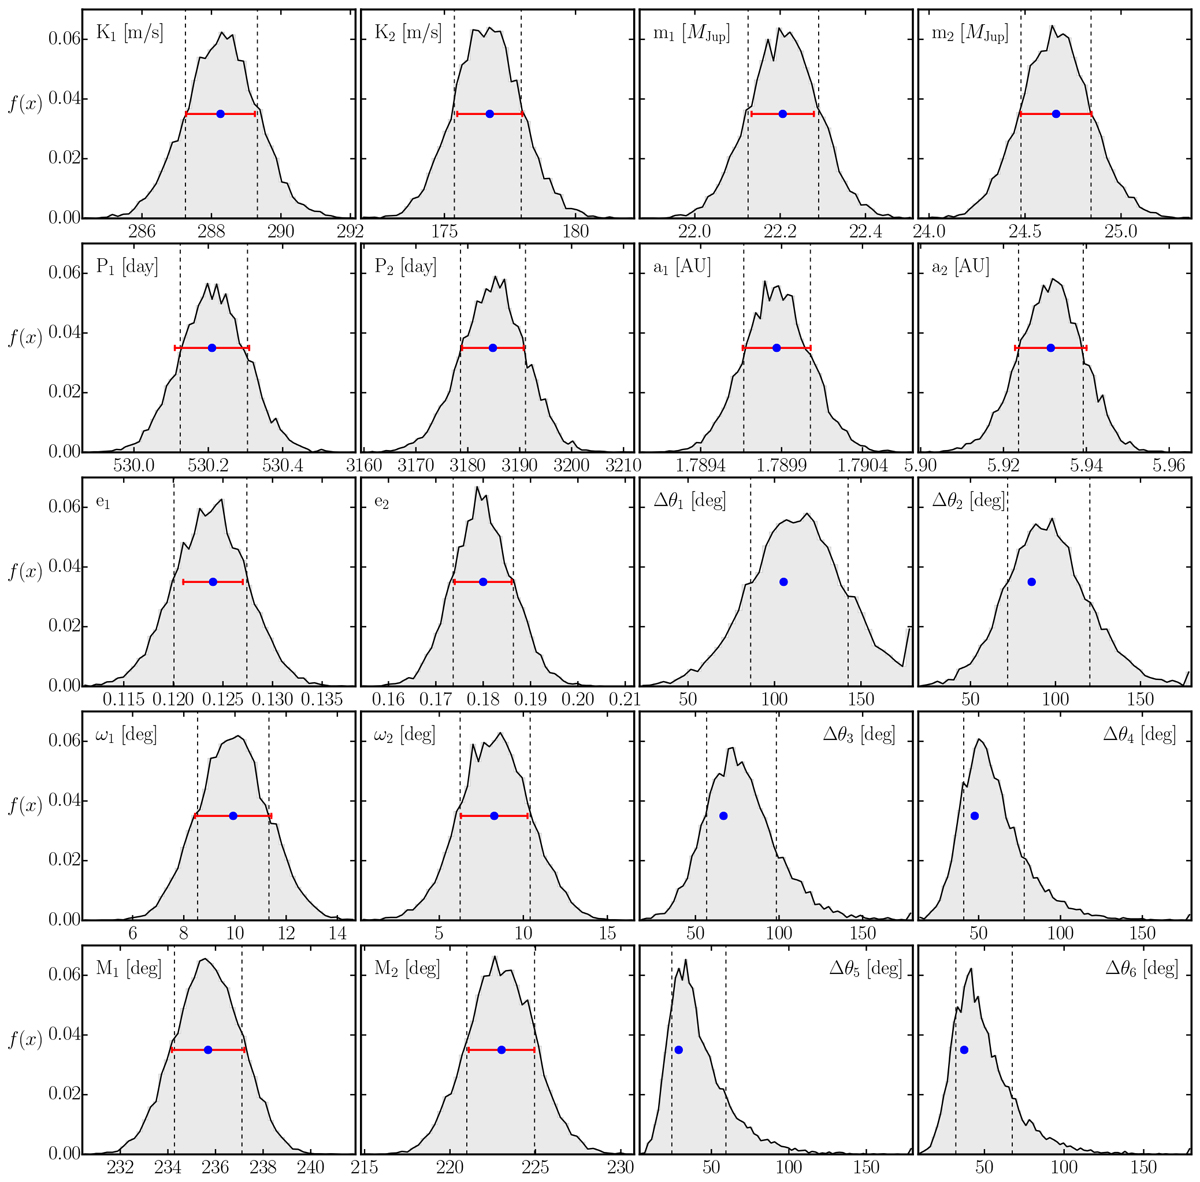
First two columns: sampling distribution of all fitting parameters (K, P, e, ω, M) for a coplanar and edge-on configuration constructed from 5000 bootstrap samples. All bootstrap samples are stable for 10 Myr. Third and fourth columns: derived distribution of companion masses (m) and semimajor axes (a), and the libration semi-amplitudes of the resonance angles (θ1–θ6). The bluedots are the location of the best dynamical fit in phase space for both companions. The red error bars are the uncertainties estimated from the covariance matrix, while the errors in a and m are obtained through error propagation from these uncertainties. Clearly, for all orbital elements the best-fit values and their errors from the covariance matrix are consistent with the bootstrap distribution peak and the corresponding 68.3% confidence level (vertical dashed lines).
Current usage metrics show cumulative count of Article Views (full-text article views including HTML views, PDF and ePub downloads, according to the available data) and Abstracts Views on Vision4Press platform.
Data correspond to usage on the plateform after 2015. The current usage metrics is available 48-96 hours after online publication and is updated daily on week days.
Initial download of the metrics may take a while.