Fig. 4
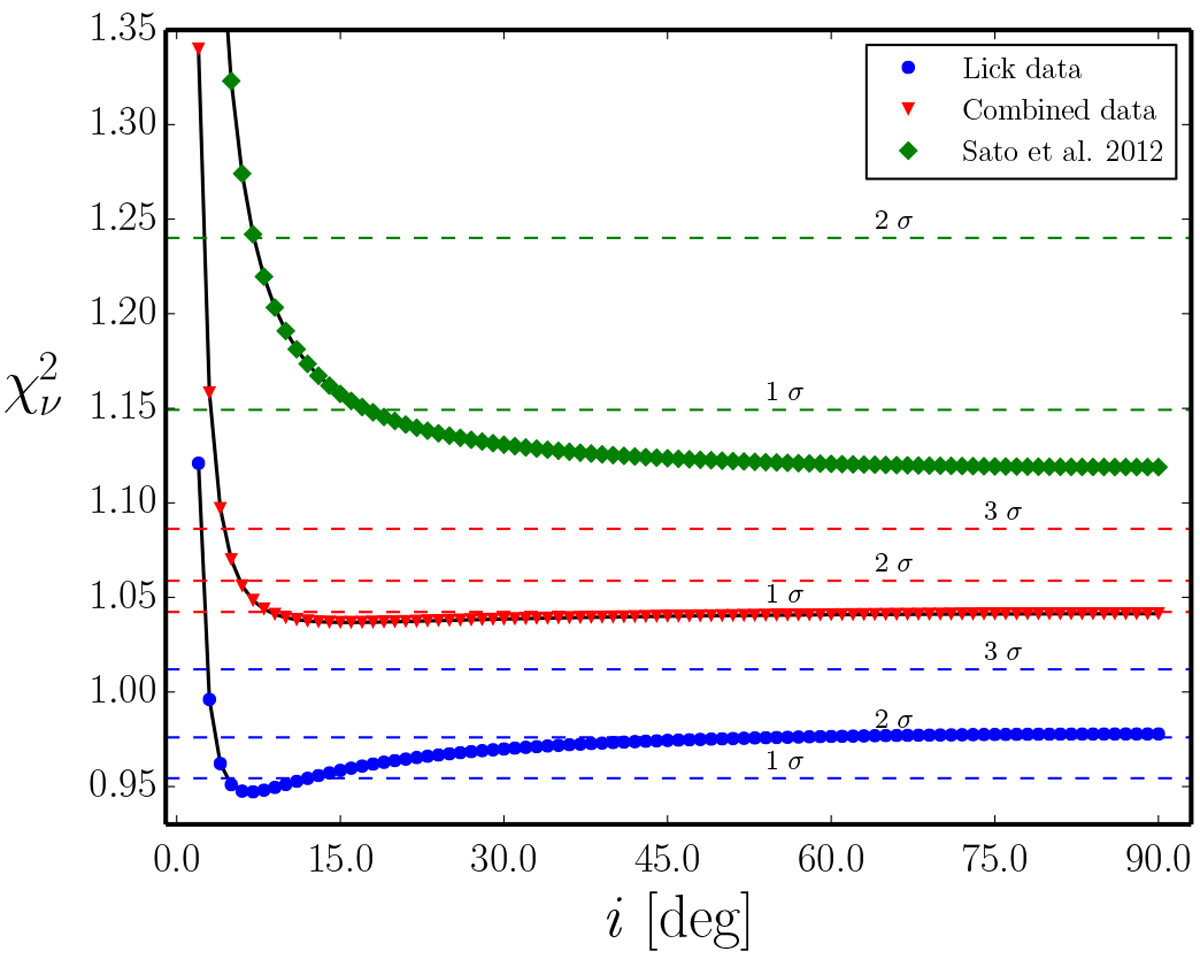
Resulting ![]() for coplanar dynamical fits as a function of inclination separately for Lick (blue) and OAO data (green), and for the combined data sets (red). The test starts at i = 90° and goes down to i = 3° with a step size of − 1°. Black lines are the 1 D χ2 curves interpolated from the individual fits and applied to individual data sets. The dashed lines represent 1σ, 2σ, and 3σ levels obtained from Δχ2 confidence values of 1.0, 4.0, and 9.0 larger than the χ2 minimum achieved for each data set. For the Lick data, the minimum at i = 7° is statistically significant at the 2σ level, indicating that an inclined solution is slightly preferred, while the OAO data has its minimum at i = 90°, showing that near edge-on configurations are preferred. For the combined data the minimum is around i = 16°, but is within1σ from the coplanar edge-on fit.
for coplanar dynamical fits as a function of inclination separately for Lick (blue) and OAO data (green), and for the combined data sets (red). The test starts at i = 90° and goes down to i = 3° with a step size of − 1°. Black lines are the 1 D χ2 curves interpolated from the individual fits and applied to individual data sets. The dashed lines represent 1σ, 2σ, and 3σ levels obtained from Δχ2 confidence values of 1.0, 4.0, and 9.0 larger than the χ2 minimum achieved for each data set. For the Lick data, the minimum at i = 7° is statistically significant at the 2σ level, indicating that an inclined solution is slightly preferred, while the OAO data has its minimum at i = 90°, showing that near edge-on configurations are preferred. For the combined data the minimum is around i = 16°, but is within1σ from the coplanar edge-on fit.
Current usage metrics show cumulative count of Article Views (full-text article views including HTML views, PDF and ePub downloads, according to the available data) and Abstracts Views on Vision4Press platform.
Data correspond to usage on the plateform after 2015. The current usage metrics is available 48-96 hours after online publication and is updated daily on week days.
Initial download of the metrics may take a while.