Fig. 2
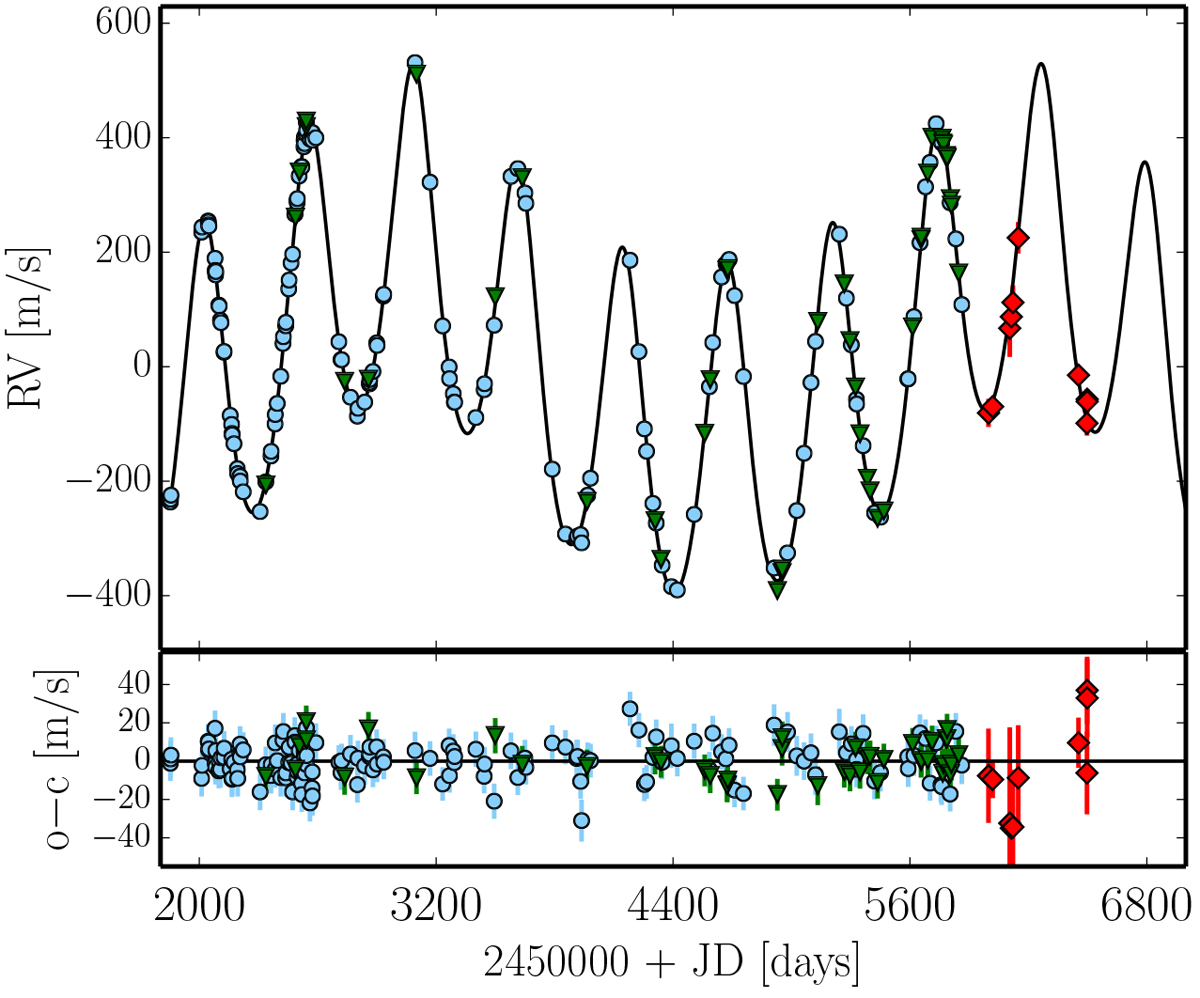
Radial velocities for ν Oph along with their error bars measured at Lick Observatory are shown with blue circles covering more than 11 yr from July 2000 to October 2011. Green triangles denote the velocities from OAO, while the VLT near-IR data are plotted with red diamonds. The solid line illustrates the best dynamical model applied to the combined optical data from Lick and OAO. The near-IR data from VLT is only superimposed on the dynamical model with the only fitting parameter being an RV offset for the whole data set. The two wavelength domains are clearly consistent with each other. Bottom panel: residuals around the best fit.
Current usage metrics show cumulative count of Article Views (full-text article views including HTML views, PDF and ePub downloads, according to the available data) and Abstracts Views on Vision4Press platform.
Data correspond to usage on the plateform after 2015. The current usage metrics is available 48-96 hours after online publication and is updated daily on week days.
Initial download of the metrics may take a while.