Fig. 3.
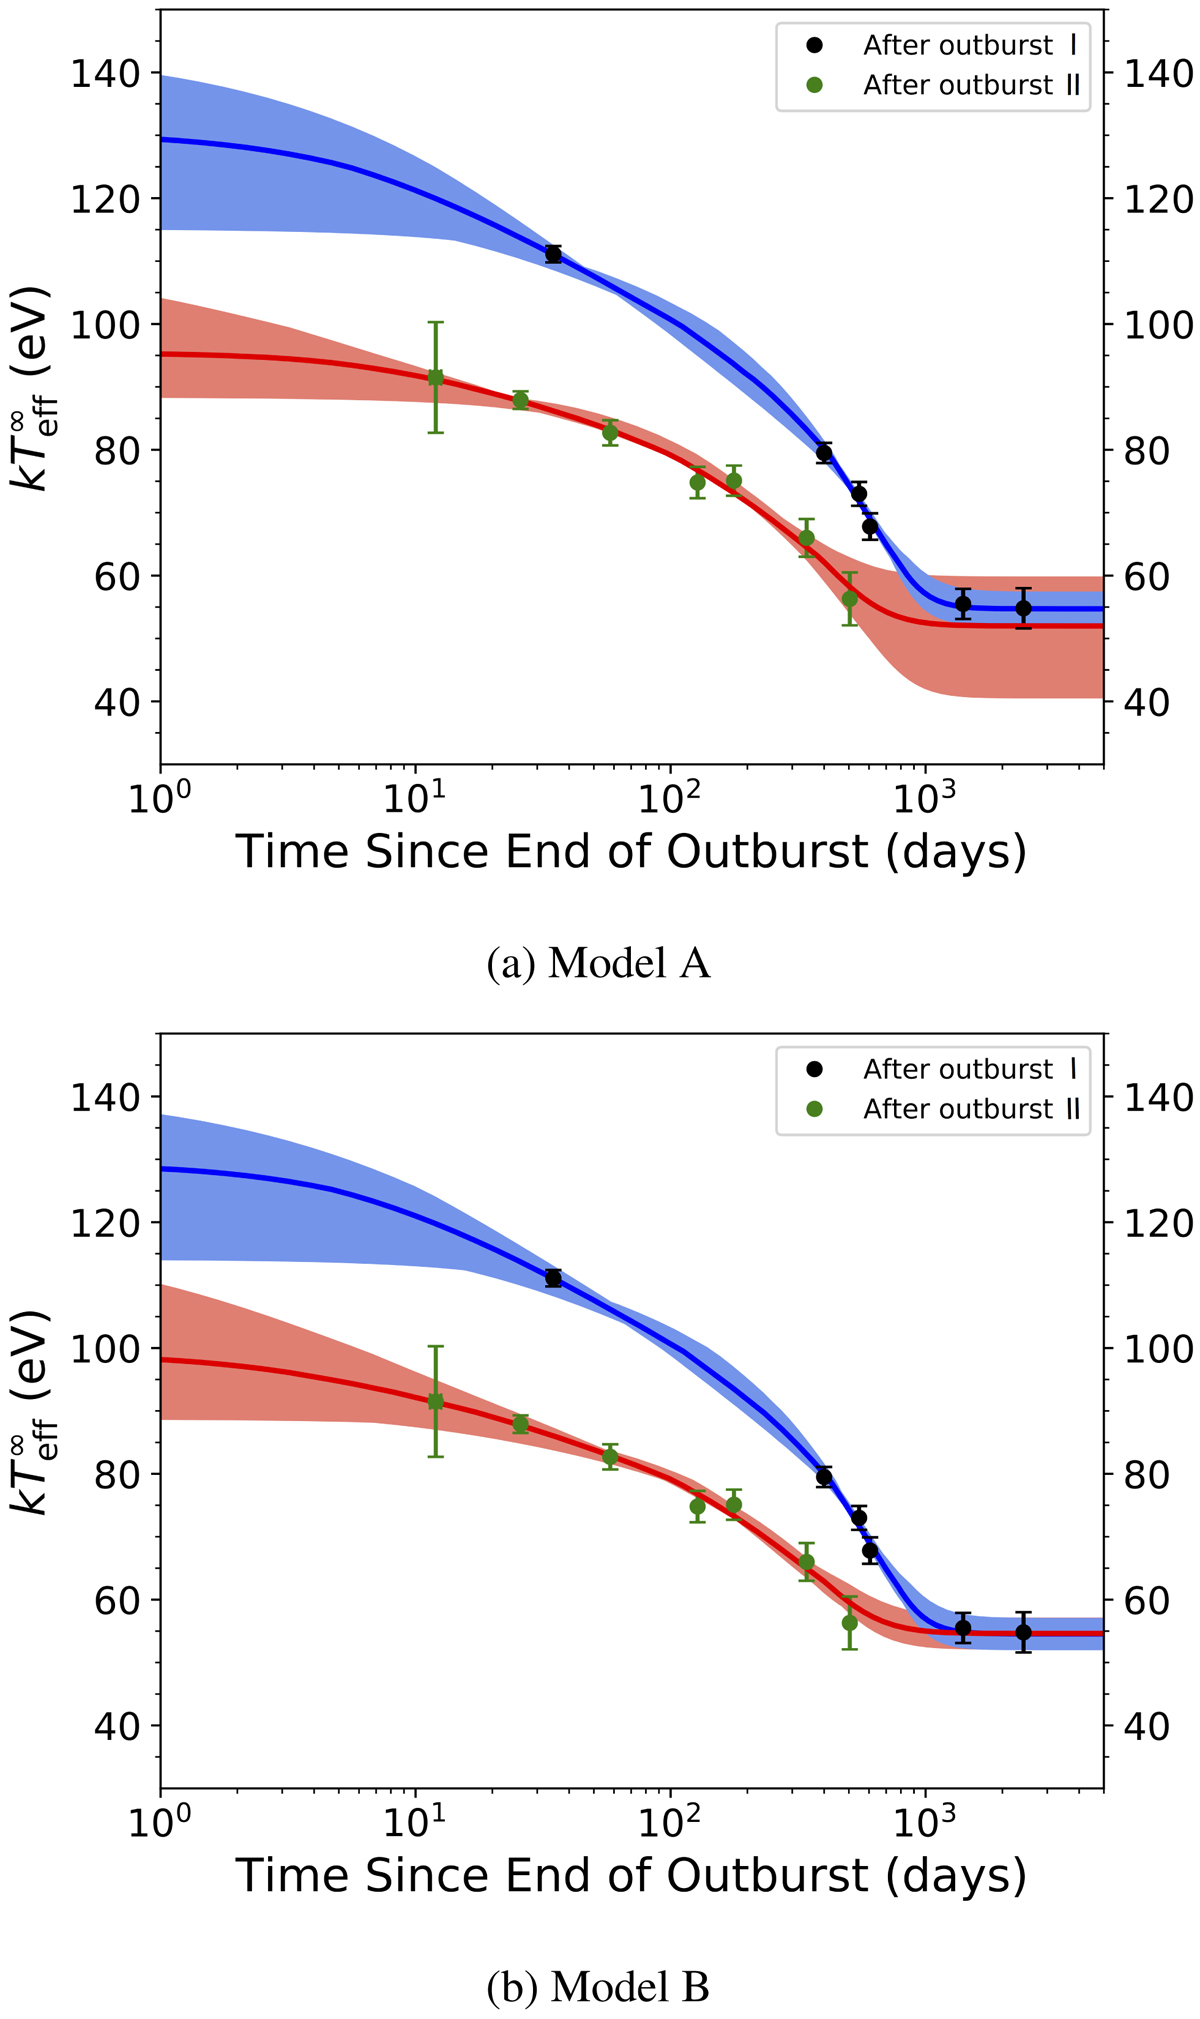
Cooling curves modelling the ![]() evolution of MXB 1659 − 29, along with the error bands on the models. The post-outburst I and post-outburst II
evolution of MXB 1659 − 29, along with the error bands on the models. The post-outburst I and post-outburst II ![]() evolution data points are shown in black and green and the modelled cooling curves are shown in blue and red, respectively. Panel a: Model A for which all parameters were free to vary. Panel b: Model B for which the ylight after the end of the two outbursts was assumed to be the same (see also Fig. 2).
evolution data points are shown in black and green and the modelled cooling curves are shown in blue and red, respectively. Panel a: Model A for which all parameters were free to vary. Panel b: Model B for which the ylight after the end of the two outbursts was assumed to be the same (see also Fig. 2).
Current usage metrics show cumulative count of Article Views (full-text article views including HTML views, PDF and ePub downloads, according to the available data) and Abstracts Views on Vision4Press platform.
Data correspond to usage on the plateform after 2015. The current usage metrics is available 48-96 hours after online publication and is updated daily on week days.
Initial download of the metrics may take a while.