Fig. 2.
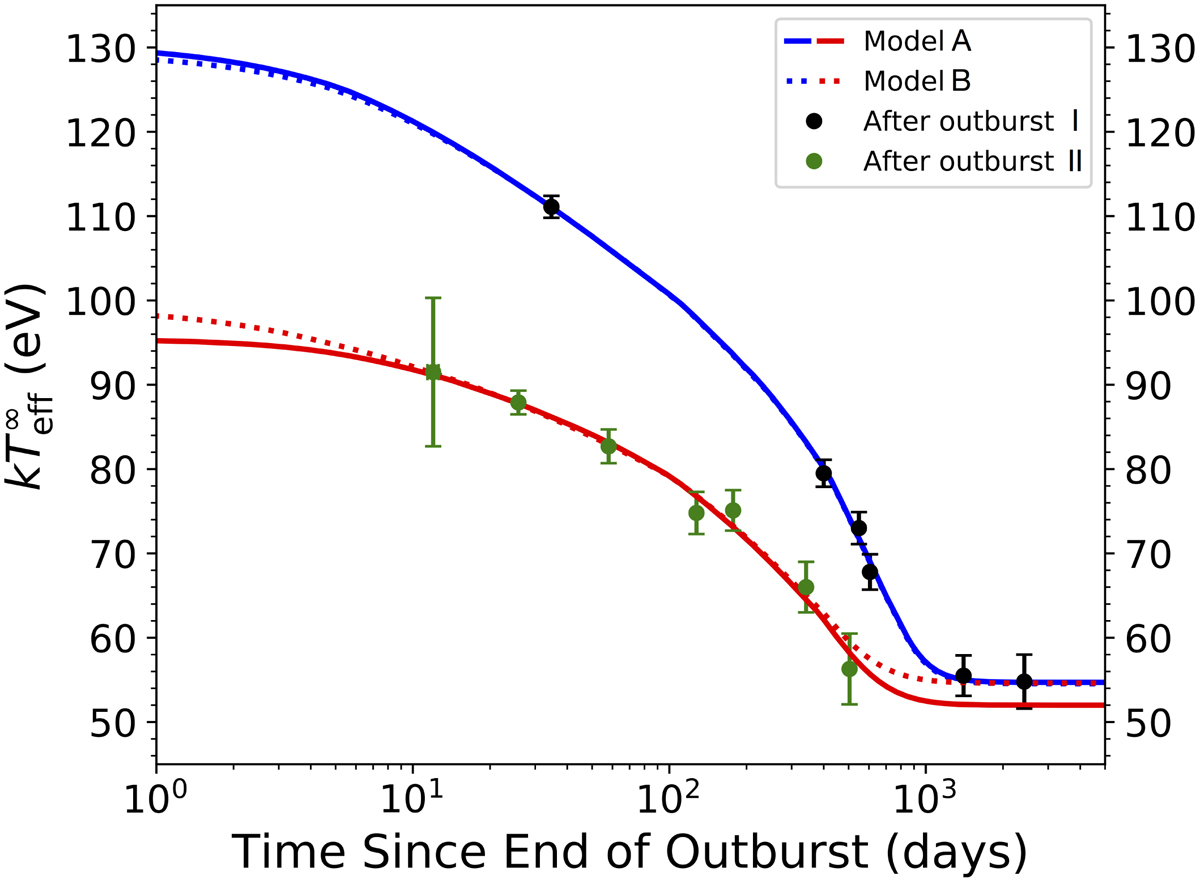
![]() evolution of MXB 1659 − 29 after outbursts I and II (black and green points, respectively). We have modelled this observed evolution with the crust heating and cooling code NSCOOL. The modelled cooling curves after outbursts I and II are shown in blue and red, respectively. Model A (shown by the solid lines) indicates the fit when all the parameters were free to vary. Model B (shown by the dotted lines) assumes that ylight after both the outbursts is the same and, therefore, that the crust returns to the same observed base level. It should be noted that Models A and B have parameters that are consistent with one another within their error bands. This is shown in Fig. 3 and Table 2.
evolution of MXB 1659 − 29 after outbursts I and II (black and green points, respectively). We have modelled this observed evolution with the crust heating and cooling code NSCOOL. The modelled cooling curves after outbursts I and II are shown in blue and red, respectively. Model A (shown by the solid lines) indicates the fit when all the parameters were free to vary. Model B (shown by the dotted lines) assumes that ylight after both the outbursts is the same and, therefore, that the crust returns to the same observed base level. It should be noted that Models A and B have parameters that are consistent with one another within their error bands. This is shown in Fig. 3 and Table 2.
Current usage metrics show cumulative count of Article Views (full-text article views including HTML views, PDF and ePub downloads, according to the available data) and Abstracts Views on Vision4Press platform.
Data correspond to usage on the plateform after 2015. The current usage metrics is available 48-96 hours after online publication and is updated daily on week days.
Initial download of the metrics may take a while.