Fig. 1.
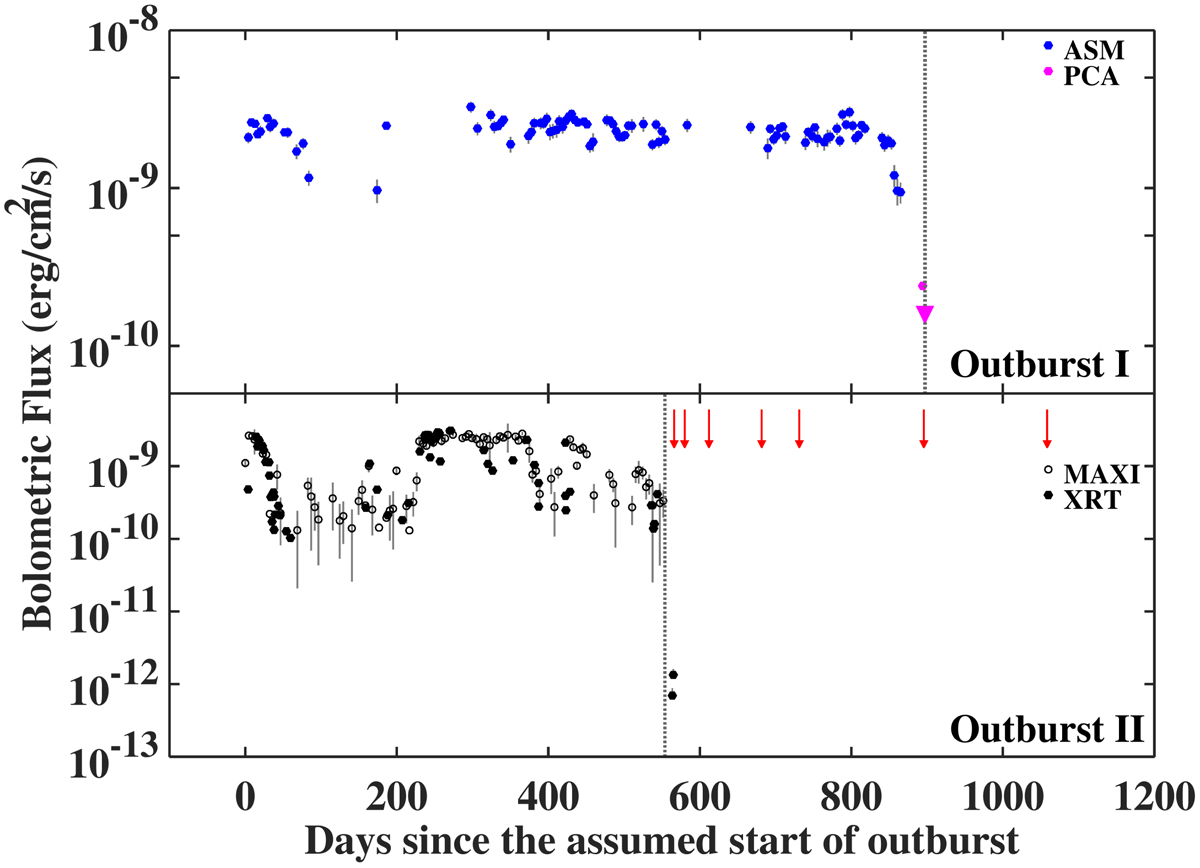
Bolometric flux (0.01–100 keV) curves for outbursts I and II (upper and lower panels, respectively). The zero points correspond to MJD 51265 for outburst I and MJD 57256 for outburst II. The vertical grey dotted lines indicate the time of the end of the respective outbursts (MJD 52162 and MJD 57809.7, respectively). For outburst I, the ASM data are shown in blue and the PCA data near the end of the outburst (including the upper limit indicated by the downward facing triangle) are shown in magenta. For outburst II, the MAXI and XRT data are shown by open and filled black circles, respectively. The vertical red arrows in the lower panel indicate the times of the observations of the source in quiescence after the end of outburst II (see Sect. 2.2 and Table 1, for details).
Current usage metrics show cumulative count of Article Views (full-text article views including HTML views, PDF and ePub downloads, according to the available data) and Abstracts Views on Vision4Press platform.
Data correspond to usage on the plateform after 2015. The current usage metrics is available 48-96 hours after online publication and is updated daily on week days.
Initial download of the metrics may take a while.