Fig. 5
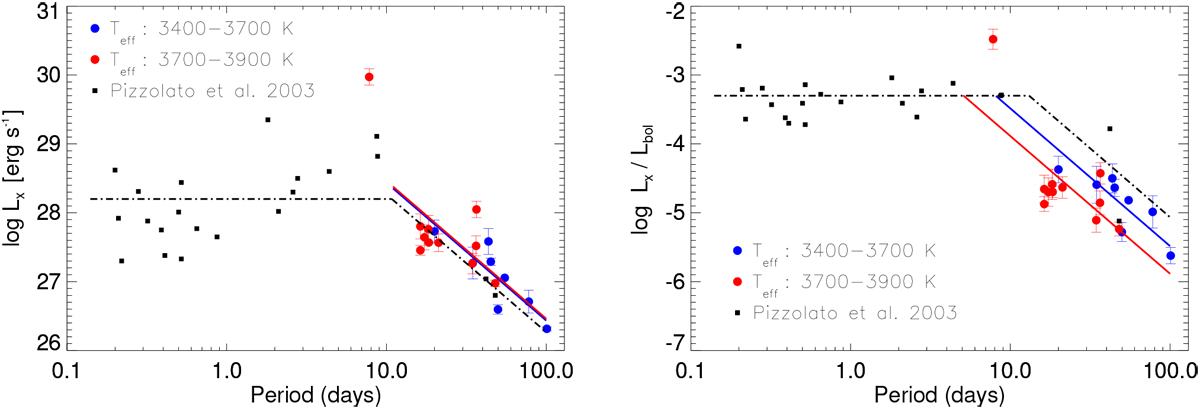
Lx (left) and Lx∕Lbol (right) vs. rotation period for stars with direct rotation period determination. The black squares correspond to the stellar sample from Pizzolato et al. (2003) in the mass range 0.22 < M∕M⊙ < 0.60. The blue and red dots correspond to the M dwarfs from this work in the two different ranges of Teff indicated inthe legend. The black dot-dashed line represents the broken power law obtained by the fitting procedure from Pizzolato et al. (2003). The blue and red solid line represents our best fit for the 3400–3700 and 3700–3900 K Teff range, respectively.
Current usage metrics show cumulative count of Article Views (full-text article views including HTML views, PDF and ePub downloads, according to the available data) and Abstracts Views on Vision4Press platform.
Data correspond to usage on the plateform after 2015. The current usage metrics is available 48-96 hours after online publication and is updated daily on week days.
Initial download of the metrics may take a while.