Fig. 4
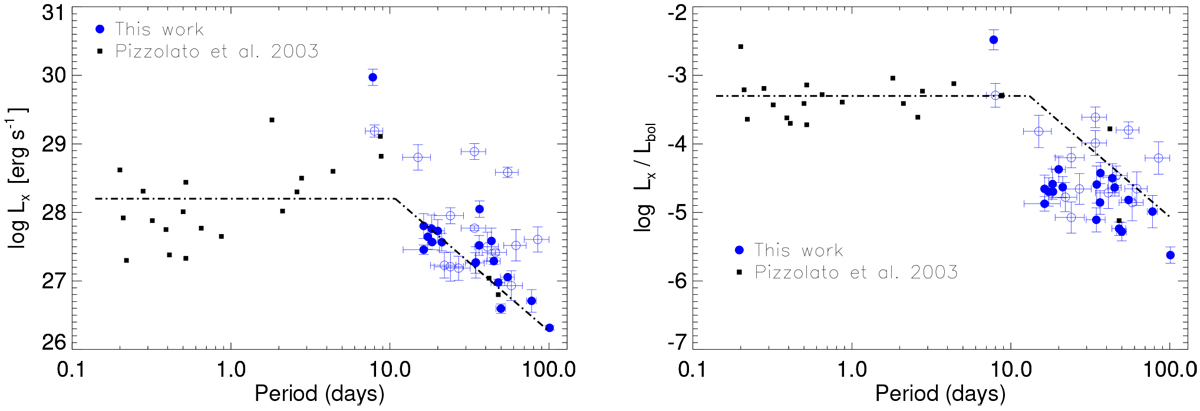
Lx (left) and Lx∕Lbol (right) vs. rotation period. The black squares correspond to the stellar sample from Pizzolato et al. (2003) in the mass range 0.22 <M∕M⊙ < 0.60. The large blue dots correspond to the M dwarfs with periods measured from time series and used in the analysis. The open blue circles show the derived period from an activity–rotation relation (excluded from the analysis). The black dot-dashed line represents the broken power law obtained by the fitting procedure from Pizzolato et al. (2003) with Prot values estimated from vsini in saturated regime.
Current usage metrics show cumulative count of Article Views (full-text article views including HTML views, PDF and ePub downloads, according to the available data) and Abstracts Views on Vision4Press platform.
Data correspond to usage on the plateform after 2015. The current usage metrics is available 48-96 hours after online publication and is updated daily on week days.
Initial download of the metrics may take a while.