Fig. 4
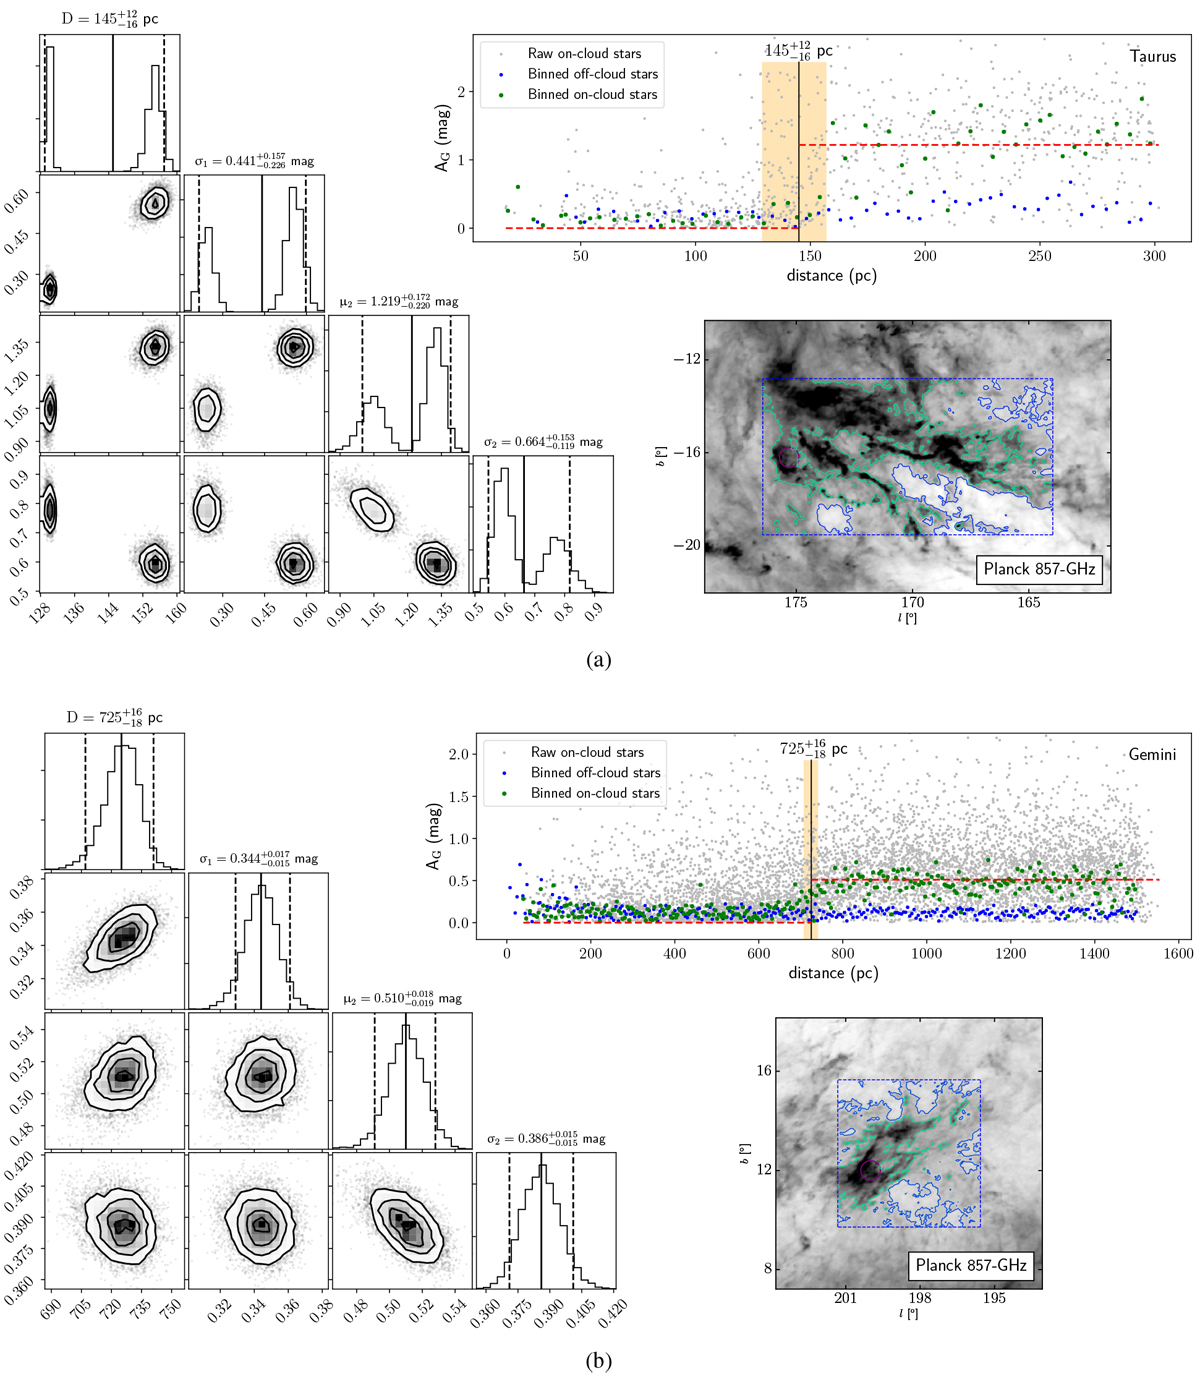
Distance of the Taurus (panel a) and Gemini (panel b) molecular clouds. In the panels at the bottom right, showing the Planck 857 GHz images, purple circles mark the position of molecular clouds, while the blue and green contours correspond to the noise and signal thresholds in Fig. 2, respectively. Top right panel: green and blue points present on- and off-cloud stars (binned every 5 pc), respectively. The dashed red lines are the modeled extinction AG. The distances were derived with raw on-cloud Gaia DR2 stars, which are represented with gray points. The black vertical lines indicate the distance (D) estimated with Bayesian analyses and MCMC sampling, and the shadow areas depict the 95% HPD distance range. The corner plots of the MCMC samples are displayed on the left. The mean and 95% HPD of the samples are shown with solid and dashed vertical lines, respectively, and the systematic uncertainty is not included. The Taurus molecular cloud may contain two components.
Current usage metrics show cumulative count of Article Views (full-text article views including HTML views, PDF and ePub downloads, according to the available data) and Abstracts Views on Vision4Press platform.
Data correspond to usage on the plateform after 2015. The current usage metrics is available 48-96 hours after online publication and is updated daily on week days.
Initial download of the metrics may take a while.