Fig. 7.
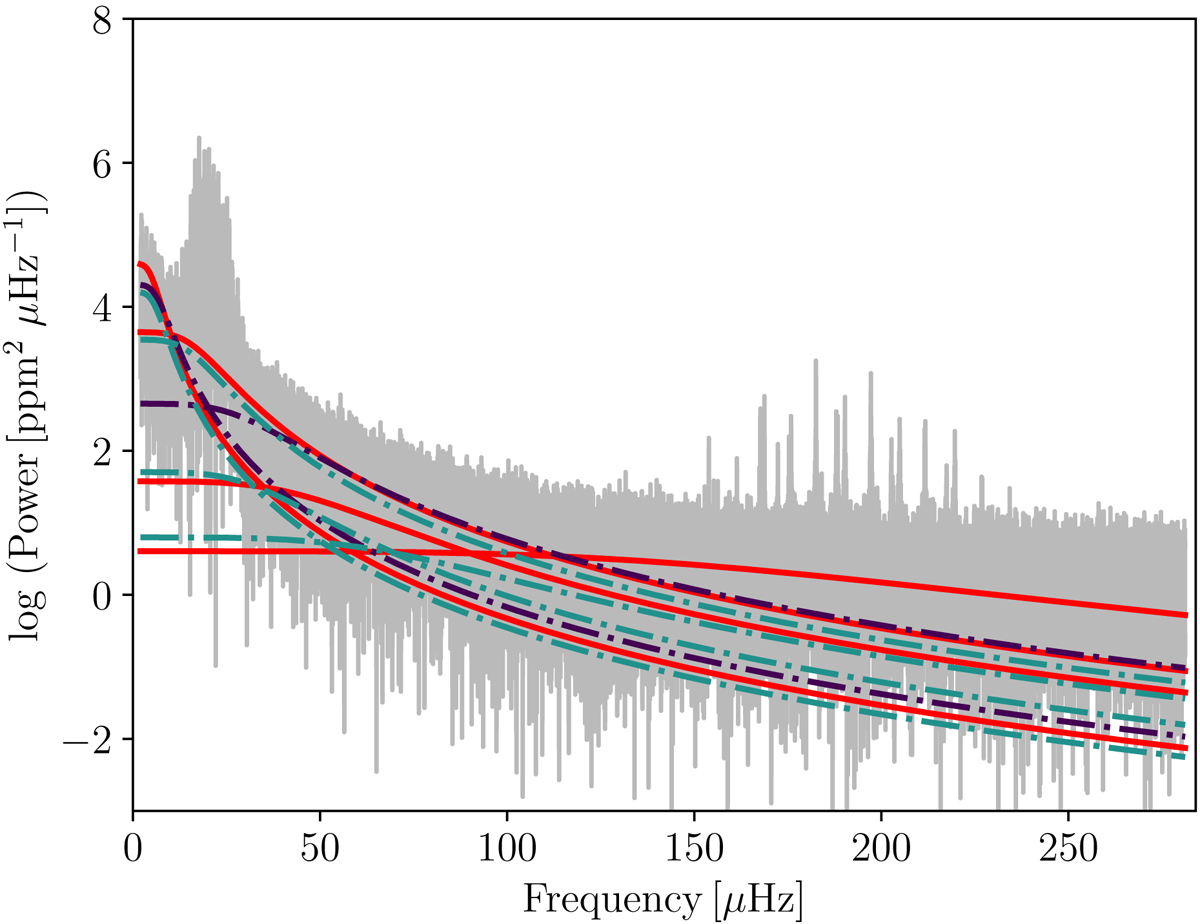
Comparison of the input granulation signal with those from the maximum-likelihood values of the two and four super-Lorentzian granulation model fits, for one of our binary-RG PSDs where both components are pulsating. The super-Lorentzians used as inputs are represented by the solid red curves, with the two and four super-Lorentzians fits represented by the dark blue and blue-green dash-dotted lines respectively.
Current usage metrics show cumulative count of Article Views (full-text article views including HTML views, PDF and ePub downloads, according to the available data) and Abstracts Views on Vision4Press platform.
Data correspond to usage on the plateform after 2015. The current usage metrics is available 48-96 hours after online publication and is updated daily on week days.
Initial download of the metrics may take a while.