Free Access
Fig. 6.
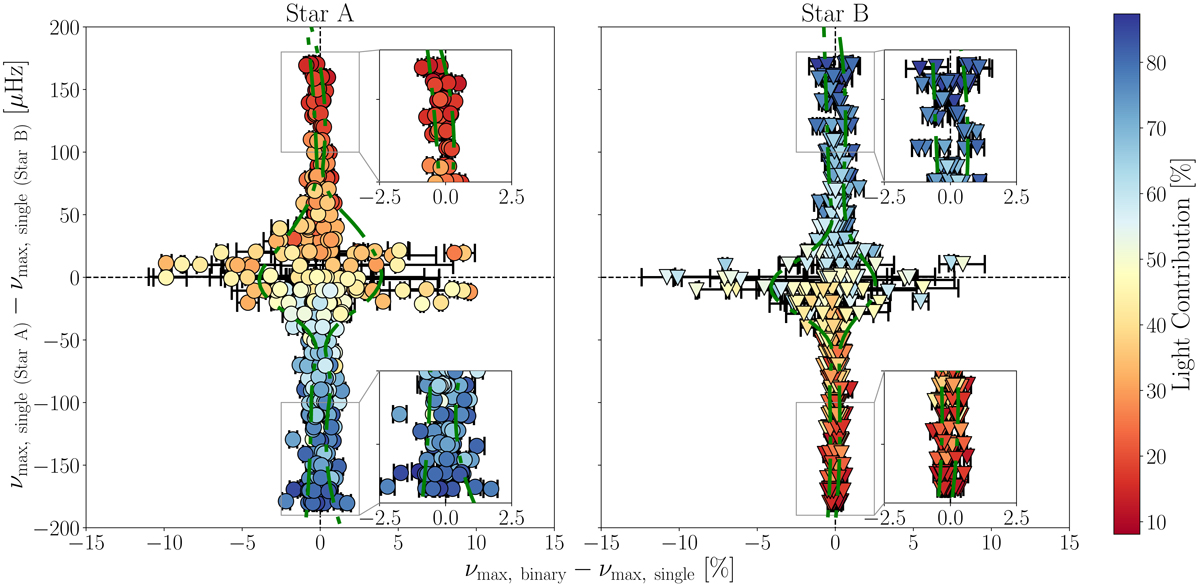
Comparison of the νmax values of each component (Star A, left panel; and Star B, right panel) extracted from our synthetic RG-binary light curves where both components are pulsating, using a four super-Lorentzian granulation model. The axes, symbols, error bars and colour-coding is the same as in Fig. 5.
Current usage metrics show cumulative count of Article Views (full-text article views including HTML views, PDF and ePub downloads, according to the available data) and Abstracts Views on Vision4Press platform.
Data correspond to usage on the plateform after 2015. The current usage metrics is available 48-96 hours after online publication and is updated daily on week days.
Initial download of the metrics may take a while.