Fig. 5.
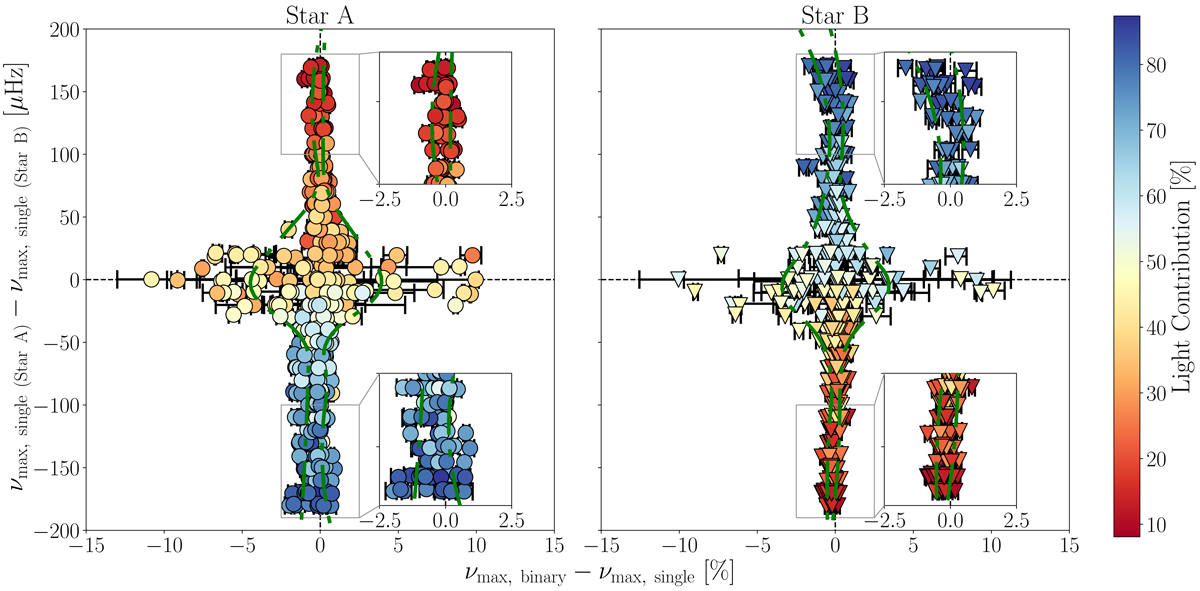
Comparison of the νmax values of each component (Star A, left panel; and Star B, right panel) extracted from our synthetic RG-binary light curves where both components are pulsating, using a two super-Lorentzian granulation model. The vertical axis corresponds to the difference between the single-RG reference values for Star A (νmax, single (Star A)) and Star B (νmax, single (Star B)). The horizontal axis corresponds to the difference between the binary (νmax, binary) and the single-RG (νmax, single) reference values. The vertical dashed line represents the zero-point of the difference between νmax, binary and νmax, single. The dash-dotted green lines represent the interpolated 1 − σ level about the mean scatter of the datapoints grouped into 10 μHz bins along the vertical axis. The horizontal dashed line represents the zero-point of νmax, single (Star A) − νmax, single (Star B). The error bars correspond to the 68% Bayesian credible intervals of the marginalised posterior distributions of the binary fit parameters. The symbols are colour-coded according the percentage light contribution of each component to the binary light curve.
Current usage metrics show cumulative count of Article Views (full-text article views including HTML views, PDF and ePub downloads, according to the available data) and Abstracts Views on Vision4Press platform.
Data correspond to usage on the plateform after 2015. The current usage metrics is available 48-96 hours after online publication and is updated daily on week days.
Initial download of the metrics may take a while.